Note:
This topic has been translated from a Chinese forum by GPT and might contain errors.
Original topic: Datax 写入TIDB 慢,5000条/s 下降至 200条/s
【TiDB Usage Environment】Production Environment
【TiDB Version】6.5.2
【Reproduction Path】jdbc, channel, batchsize
【Encountered Problem: Phenomenon and Impact】Sudden decrease in write performance
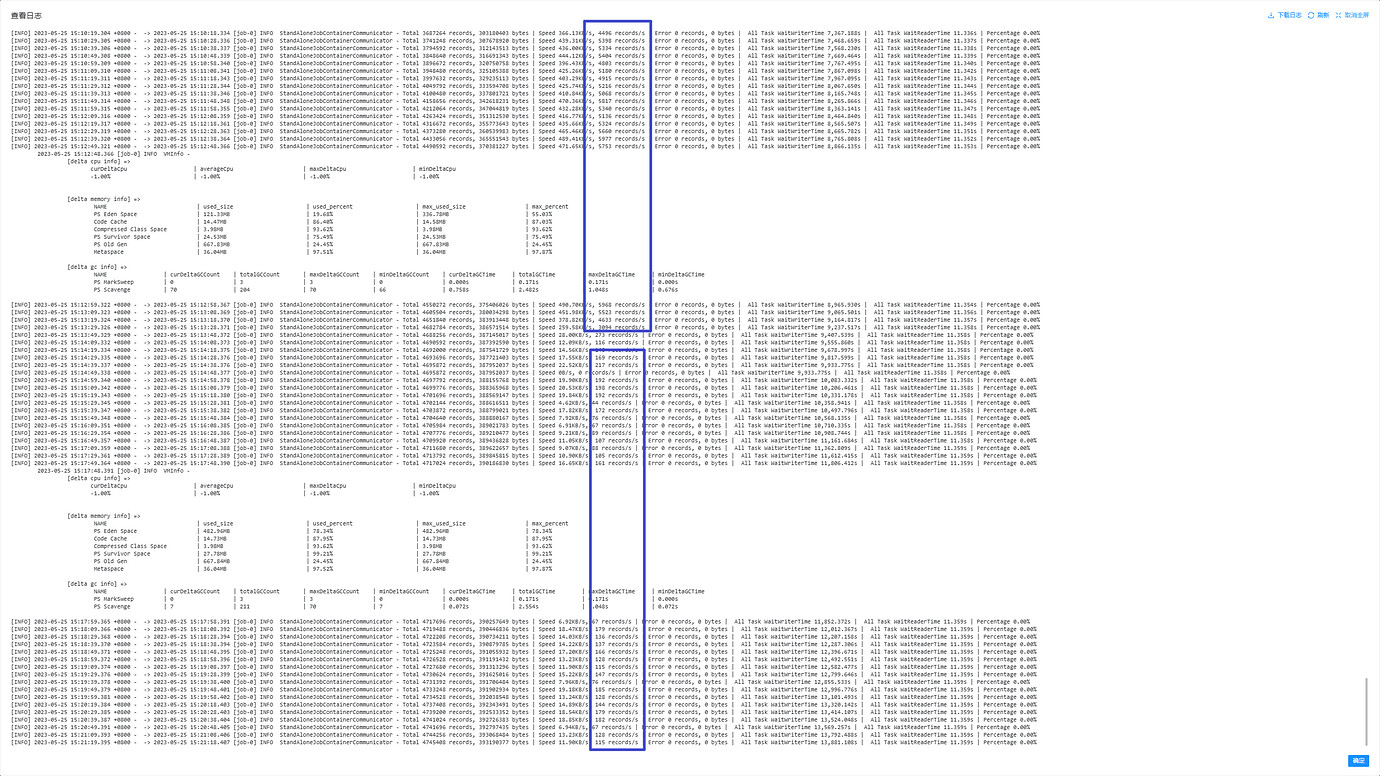
【Attachment: Screenshot/Log/Monitoring】
reader: hdfs reader
channel: 10
batchsize: 1024
“jdbcUrl”: “jdbc:mysql://xxxx:4000/ads_global?useUnicode=true&characterEncoding=utf-8&useSSL=false&autoReconnect=true&useServerPrepStmts=true&cachePrepStmts=true&prepStmtCacheSize=1000&prepStmtCacheSqlLimit=2048000&useConfigs=maxPerformance&rewriteBatchedStatements=true&allowMultiQueries=true&useCursorFetch=true&netTimeoutForStreamingResults=28800&sessionVariables=wait_timeout=123456”
 Is the downstream pressure high?
Could you please share the table schema for writing into the table?
Granfa checks the load status of each node.
CREATE TABLE ods_crm_biz_t_integral_account_log (
id bigint(64) NOT NULL AUTO_INCREMENT,
member_id bigint(64) NOT NULL COMMENT ‘Member ID’,
integral_type varchar(50) NOT NULL COMMENT ‘Integral Type’,
integral_value decimal(12,2) DEFAULT NULL COMMENT ‘Integral Value’,
tran_id bigint(64) DEFAULT NULL COMMENT ‘Transaction ID’,
tran_no varchar(50) DEFAULT NULL COMMENT ‘Transaction Number’,
update_type int(2) DEFAULT NULL COMMENT ‘Change Type (1: Increase, 2: Decrease)’,
accruals_id bigint(64) DEFAULT NULL COMMENT ‘Accruals ID’,
oper_src int(2) DEFAULT ‘1’ COMMENT ‘Source (1: Increase, 2: Decrease, 4: Initialize Integral, 5: Manual Adjustment, 6: Integral Reset, 7: Integral to Coupon, 8: Integral to Voucher)’,
repay_id varchar(10000) DEFAULT NULL COMMENT ‘Repayment ID’,
tenant_id varchar(10) DEFAULT NULL COMMENT ‘Tenant ID’,
create_dept bigint(64) DEFAULT NULL COMMENT ‘Creating Department’,
create_position bigint(64) DEFAULT NULL COMMENT ‘Creating Position’,
create_user bigint(64) DEFAULT NULL COMMENT ‘Creator’,
create_time datetime DEFAULT NULL COMMENT ‘Creation Time’,
update_user bigint(64) DEFAULT NULL COMMENT ‘Modifier’,
update_time datetime DEFAULT NULL COMMENT ‘Modification Time’,
status int(2) DEFAULT NULL COMMENT ‘Status’,
is_deleted int(2) DEFAULT ‘0’ COMMENT ‘Is Deleted (0: Normal, 1: Deleted)’,
original_member_id bigint(64) DEFAULT NULL COMMENT ‘Original Member ID’,
original_card_no varchar(100) DEFAULT NULL COMMENT ‘Original Member Card Number’,
original_member_comments varchar(2000) DEFAULT NULL COMMENT ‘Original Member Comments’,
PRIMARY KEY (id) /*T![clustered_index] CLUSTERED */,
KEY t_integral_account_log_index1 (member_id,integral_type),
KEY t_integral_account_log_index2 (tran_id),
KEY t_integral_account_log_index3 (tran_no),
KEY t_integral_account_log_index4 (create_time)
) ENGINE=InnoDB DEFAULT CHARSET=utf8mb4 COLLATE=utf8mb4_bin AUTO_INCREMENT=1594605659184571699 COMMENT=‘Integral Account Change Log’
Are you considering hotspot issues? Previously tested adding things under the table to scatter it, but it didn’t work very well.
Other tables didn’t encounter this issue during synchronization.
Currently, there is no pressure.
It should be a hotspot issue. Check the hotspot situation of this table during import under the dashboard. My suggestion is to change AUTO_INCREMENT to AUTO_RANDOM in the table creation statement.
Other tasks are currently writing at a speed of 1000 entries per second, but this task is only at 200 entries per second. Also, it can’t be found in the hotspot.
Looking at your table structure, it can be seen that the current value of AUTO_INCREMENT is too large, which seems to be problematic. It is recommended to check it.
Additionally, I would like to ask if the id field carried a value during your data migration?
Personally, I suggest that it can carry a value, and the batch size can be considered to be reduced a bit.
Lastly, I personally feel that it is caused by the hotspot issue of AUTO_INCREMENT — since this auto-increment leads to inserts being executed only on one TiDB; other tasks can execute inserts on different TiDBs.
With values, each batch contains 200 entries, not much difference. Currently, the maximum is 1300 entries per second.
With values, each batch has 200 entries, not much difference. Currently, the highest is 1300 entries per second.
With values, if you try to make it as unordered as possible, it should be much better.
Out-of-order might be unavoidable. I’m synchronizing data from the upstream, and that’s just how it is.
If it is confirmed that data will always be written to TiDB synchronously in the future, you can consider removing the AUTO_INCREMENT attribute and changing the primary key to member_id, integral_type, id, and deleting the secondary index member_id, integral_type.
The benefit is to use the discrete nature of the business member_id to distribute the data.
However, note that when data queries need to filter by id, try to change other secondary indexes to tran_id+id, etc., to accelerate query performance and reduce latency caused by table lookups.
This has dropped too much. Is the environment normal?
There should have been some operations that affected it, right? Or change the target end to MySQL to verify if it’s a TiDB issue.