Note:
This topic has been translated from a Chinese forum by GPT and might contain errors.Original topic: dm 监控指标和实际的采集指标不一致
[TiDB Usage Environment] Test Environment
[TiDB Version] 6.1.1
[Reproduction Path] Using the DM component to migrate MySQL data to TiDB
[Encountered Issue: Problem Phenomenon and Impact]
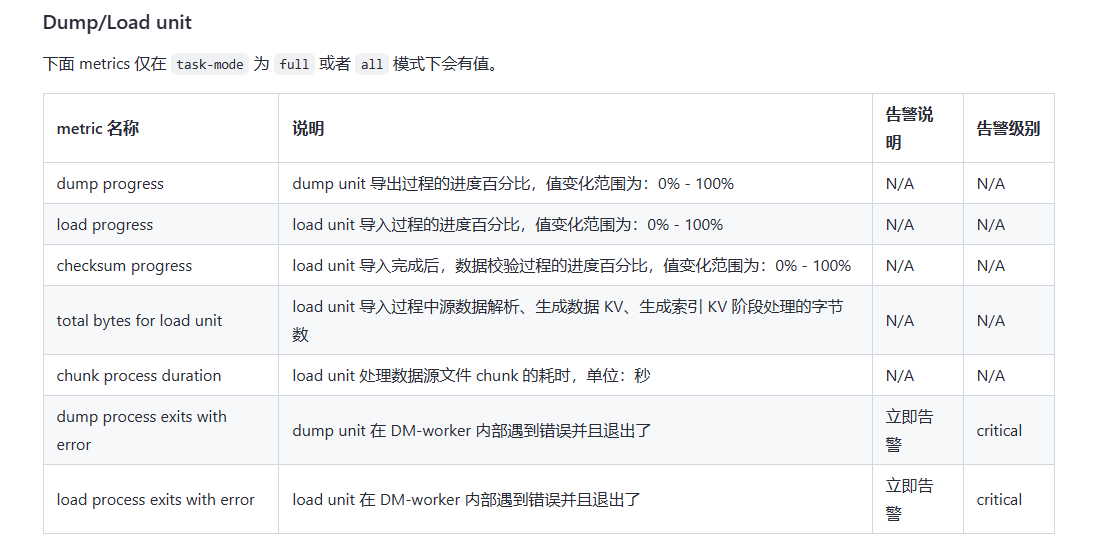
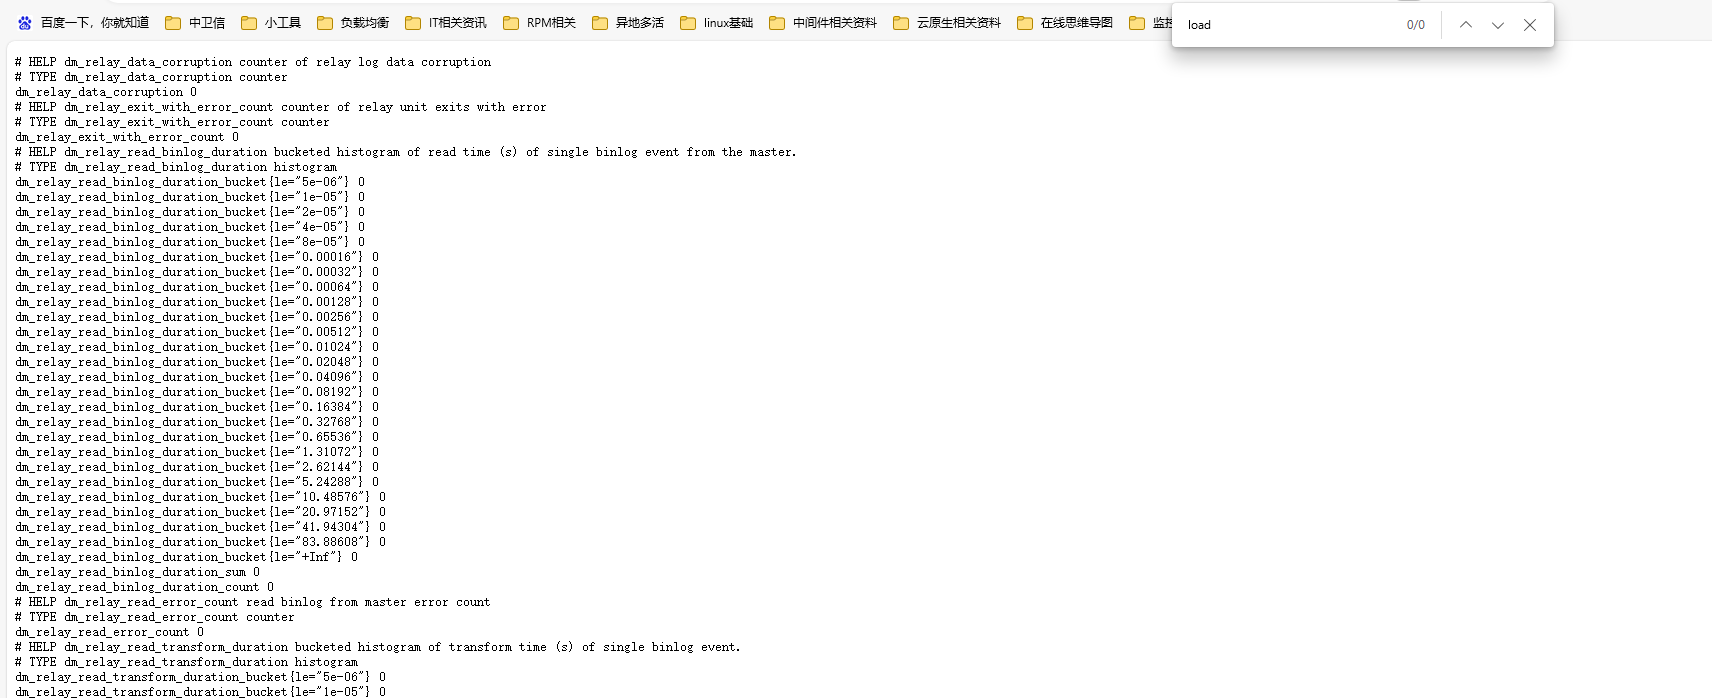
When performing the load operation using the DM component, the CPU and IO of the TiDB cluster continuously spike. I wanted to check the relevant monitoring data but found that the monitoring indicators provided on the official website could not be found in the collected metrics.