DM Synchronization Delay Fluctuations from MySQL to TiDB

Note:
This topic has been translated from a Chinese forum by GPT and might contain errors.

Original topic: DM 同步 mysql到 tidb 延迟 波动

| username: TiDBer_BraiRIcV

[MySQL Version] 5.7
[TiDB Version] 5.4.1
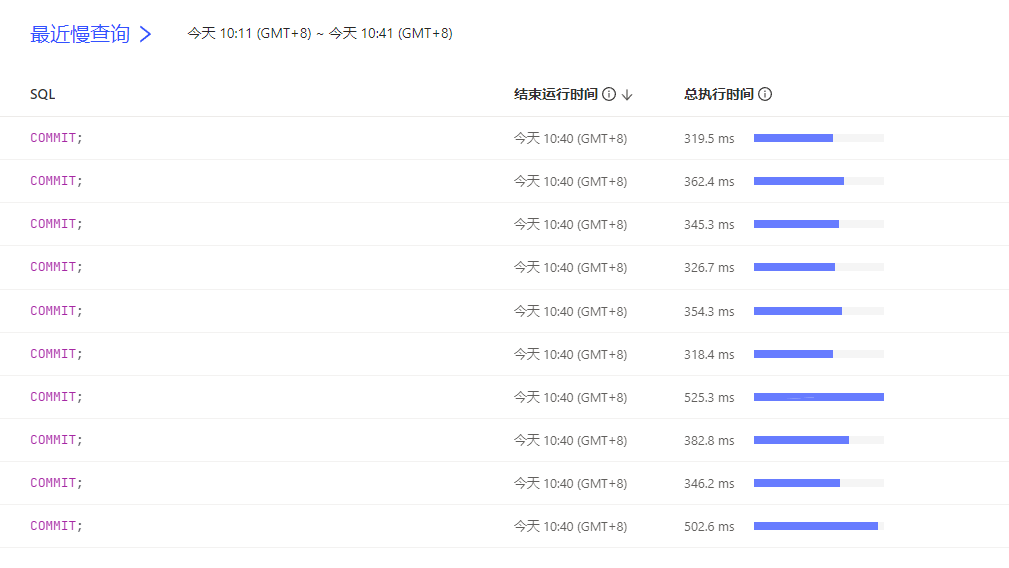
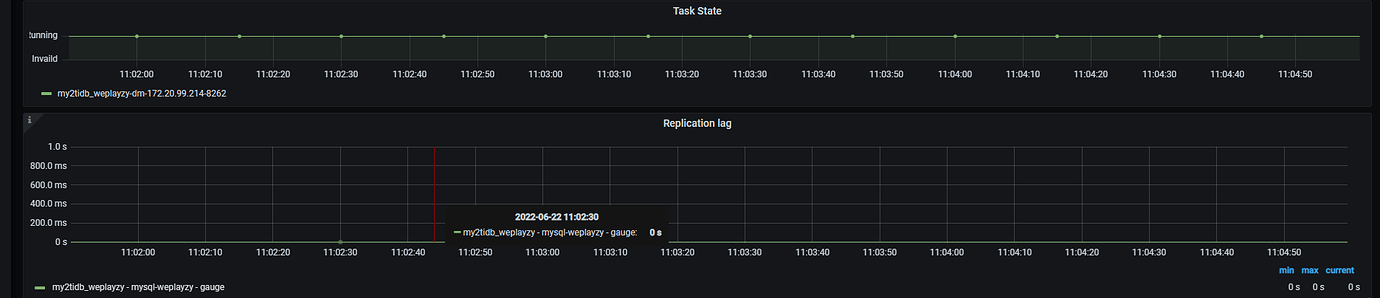
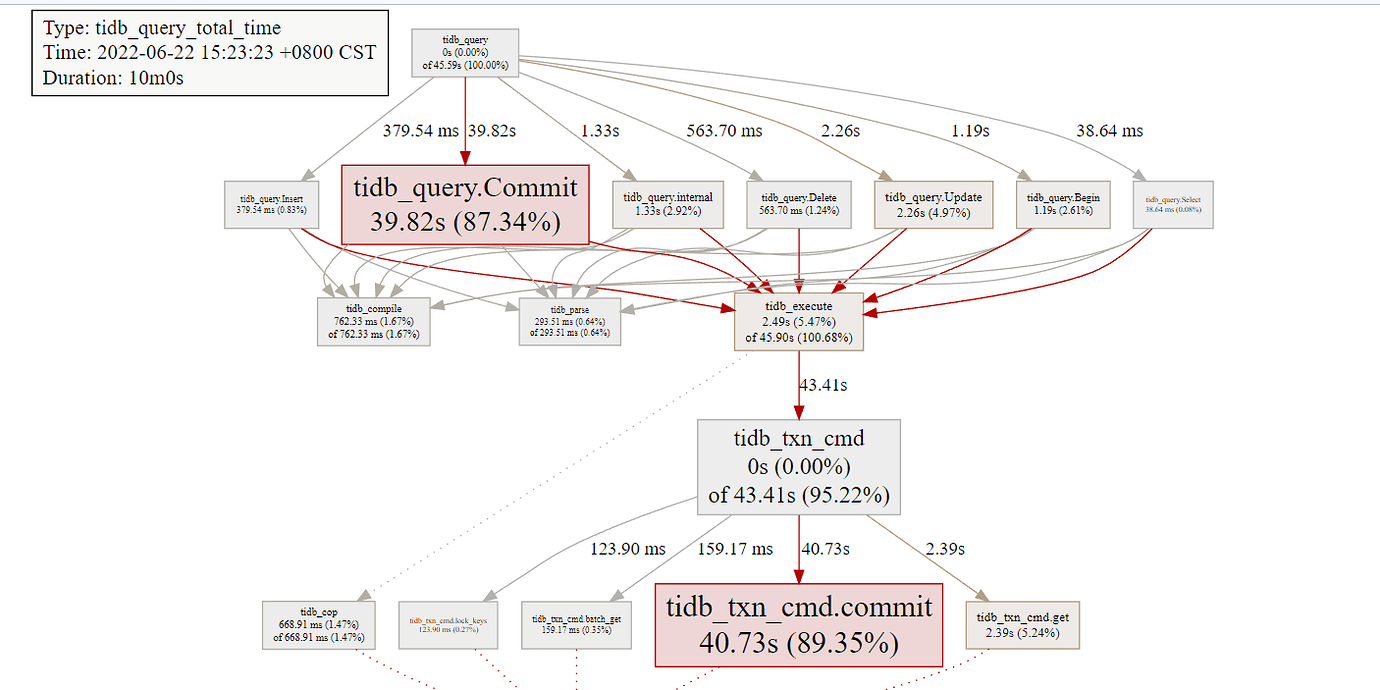
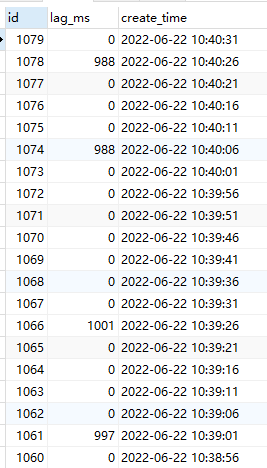
[Problem Encountered] Through our own latency monitoring and application testing, we found that the downstream TiDB latency fluctuates, sometimes being 0 and sometimes close to 1s. In the test environment with SSD and around 100 QPS, the dashboard shows slow logs all related to commit latency of 600ms (is the unstable latency related to slow commits???).

DM Configuration
# ----------- Global Configuration -----------
# Task name, must be globally unique
name: “my2tidb_xxxzy”

# Task mode, can be set to "full", "incremental", "all". "all" means full + incremental
task-mode: all    

# Database to store `meta` information downstream, sync point information is stored in the table xxxx_syncer_checkpoint
meta-schema: "dm_meta"         

# Case sensitivity
case-sensitive: false    

# Online DDL
online-ddl: true          # Supports automatic handling of upstream "gh-ost" and "pt"
#online-ddl-scheme: "pt"   # `online-ddl-scheme` will be deprecated in the future, it is recommended to use `online-ddl` instead of `online-ddl-scheme`

# Downstream database instance configuration
target-database:       
  host: "ccc"
  port: 4000
  user: "root"
  password: "zLHo4i9gnUshZyPgIKZvXECpFxInJEA="         # It is recommended to use the encrypted ciphertext by dmctl
  max-allowed-packet: 67108864                         # TiDB default 67108864 (64 MB)

# Black and white list configuration
block-allow-list:                     # Block-allow-list filtering rule set for tables matched by upstream database instances
  bw-rule-1:                          # Name of the black and white list configuration
    do-dbs: ["xxx",]             
      
mydumpers:                           # Configuration parameters for the dump processing unit
  global:                            # Configuration name
    #rows: 2000                      # Enable multi-threaded concurrent export for a single table, the value is the maximum number of rows contained in each chunk exported. If rows is set, DM will ignore the value of chunk-filesize.
    threads: 4                       # Number of threads for the dump processing unit to export data from the upstream database instance, default is 4
    chunk-filesize: 64               # Size of data files generated by the dump processing unit, default is 64 MB
    extra-args: "--consistency none" # Other parameters for the dump processing unit, no need to configure table-list in extra-args, DM will automatically generate it
    
loaders:                             # Configuration parameters for the load processing unit
  global:                            # Configuration name
    pool-size: 16                    # Number of threads for the load processing unit to concurrently execute SQL files from the dump processing unit, default is 16. Normally, this does not need to be set. When multiple instances are migrating data to TiDB simultaneously, this value can be appropriately reduced based on the load.
    dir: "./dumped_data"             # Directory where the dump processing unit outputs SQL files, and also the directory where the load processing unit reads files. The default value for this configuration item is "./dumped_data". Different tasks corresponding to the same instance must configure different directories.
    
syncers:                             # Configuration parameters for the sync processing unit
  global:                            # Configuration name
    worker-count: 16                 # Number of concurrent threads applying the binlog transmitted to the local, default is 16. Adjusting this parameter will not affect the concurrency of upstream log pulling, but will put significant pressure on the downstream.
    batch: 200                       # Number of SQL statements in a transaction batch migrated to the downstream database by sync, default is 100.
    
# ----------- Instance Configuration -----------    
mysql-instances:                      
  - source-id: "mysql-xxxzy"               # Upstream instance, i.e., MySQL source_id
    block-allow-list:  "bw-rule-1"         # Name of the black and white list configuration
    mydumper-config-name: "global"          # Name of the mydumpers configuration
    loader-config-name: "global"            # Name of the loaders configuration
    syncer-config-name: "global"            # Name of the syncers configuration

Sync latency screenshot:
image

Dashboard screenshot:

| username: TiDBer_BraiRIcV | Original post link

Could the experts please advise on where optimizations can be made to reduce latency and instability?

| username: buchuitoudegou | Original post link

Is the workload purely insertions? How is the latency calculated in the monitoring? In DM’s Prometheus monitoring, you can see the lag during the incremental synchronization phase. I suggest checking if there are any significant fluctuations there.

| username: TiDBer_BraiRIcV | Original post link

Upstream MySQL has various operations, not just inserts.

Monitoring calculation method: Create a table in the upstream (with only one row of data), then periodically update it to the current data, and then read the data from this table in both upstream and downstream, compare the differences, and write the differences to the result table.

import os, time, datetime
import pymysql
from apscheduler.schedulers.blocking import BlockingScheduler
scheduler = BlockingScheduler()

'''
Upstream MySQL database and table creation

-- Connect to the database
use abc;

-- monitor_time
CREATE TABLE `monitor_time` (
  `id` bigint(20) NOT NULL AUTO_INCREMENT,
  `t` bigint(20) DEFAULT NULL,
  PRIMARY KEY (`id`)
) ENGINE=InnoDB DEFAULT CHARSET=utf8;

-- Initialize data, as the monitoring program will periodically update this record later
insert into monitor_time(t) select 1;

-- Create monitoring result table monitor_result;
CREATE TABLE `monitor_result` (
  `id` bigint(20) NOT NULL AUTO_INCREMENT,
  `lag_ms` int(11) DEFAULT NULL COMMENT 'Delay time',
  `create_time` timestamp NULL DEFAULT CURRENT_TIMESTAMP COMMENT 'Monitoring record creation time',
  PRIMARY KEY (`id`),
  KEY `idx_create_time` (`create_time`)
) ENGINE=InnoDB DEFAULT CHARSET=utf8
;
-- View results
select * from monitor_result;
'''

# Periodically update the source table monitor_time data: update to the current time
def monitor_time():
        info_src = {'user': "abc", 'passwd': "111", 'host': "xxx.96", 'db': "abc",
                          'port': 12345}
        conn_src = pymysql.connect(user=info_src['user'], passwd=info_src['passwd'],
                                    host=info_src['host'], db=info_src['db'], port=info_src['port'],
                                    charset="utf8")
        t = time.time()
        t1 = int(round(t * 1000))
        print(t1)
        cur = conn_src.cursor()
        cur.execute("update monitor_time set t=%s where 1=1 ", (str(t1)))
        conn_src.commit()

# Periodically read monitor_time, compare the difference data, and write to the table monitor_time
def monitor_result():
    info_src = {'user': "abc", 'passwd': "111", 'host': "xxx.96", 'db': "abc", 'port': 12345}
    info_des = {'user': "abc", 'passwd': "111", 'host': "xxx.118", 'db': "abc", 'port': 3390}

    # 3 days ago at the exact hour
    today = datetime.datetime.now()
    offset = datetime.timedelta(days=-3)
    date_ago = (today + offset).strftime('%Y-%m-%d 00:00:00')
    print(date_ago)

    conn_src = pymysql.connect(user=info_src['user'], passwd=info_src['passwd'],
                               host=info_src['host'], db=info_src['db'], port=info_src['port'],
                               charset="utf8")
    cur_src = conn_src.cursor()

    conn_des = pymysql.connect(user=info_des['user'], passwd=info_des['passwd'],
                               host=info_des['host'], db=info_des['db'], port=info_des['port'],
                               charset="utf8")
    cur_des = conn_des.cursor()

    sql_get_time = "select t from monitor_time "

    cur_src.execute(sql_get_time)
    v_src_tuple = cur_src.fetchone()
    t_src = v_src_tuple[0]

    cur_des.execute(sql_get_time)
    v_des_tuple = cur_des.fetchone()
    t_des = v_des_tuple[0]

    print(t_src, t_des)
    t1 = (t_src - t_des)
    cur_src.execute("insert into monitor_result(lag_ms) select %s", (str(t1)))
    conn_src.commit()

if __name__ == '__main__':
    scheduler.add_job(monitor_time, 'interval', seconds=1, id='job_monitor_time')
    scheduler.add_job(monitor_result, 'interval', seconds=5, id='monitor_result')
    scheduler.start()

DM’s Prometheus monitoring lag is almost 0:

| username: TiDBer_BraiRIcV | Original post link

Pictures20220622110650.bmp (2.9 MB)

| username: tidb狂热爱好者 | Original post link

Our company has also encountered this DM synchronization issue. The root cause is the incompatibility between MySQL and DM, specifically when there are schema changes in the upstream MySQL.

For instance, when MySQL adds or deletes a column, DM synchronization will experience significant jitter. This is because MySQL does not change the table structure immediately; there is a delay. The changes are only synchronized to the downstream TiDB after the entire structure has been modified. This action causes TiDB to experience delays ranging from 1 second to 50 seconds.

This issue is not exclusive to DM; CloudCanal also has this problem.

Our company’s solution is to avoid synchronizing schema changes at the DM layer. When encountering schema changes, we first apply the schema changes at the TiDB layer and then modify the schema in MySQL.

This approach ultimately resolved the jitter issue caused by DM.

DM not only causes jitter in TiDB but also can drag down the upstream MySQL during synchronization. You will notice this issue in practical applications.

| username: TiDBer_BraiRIcV | Original post link

In our testing environment, table structure changes are rare. Even with normal DM synchronization, there are latency fluctuations.

| username: buchuitoudegou | Original post link

  1. In the scenario of merging tables, waiting until all table structures have been changed before continuing synchronization is the normal behavior of the pessimistic synchronization mode, which will cause some delays; or are you referring to the delay caused by DML blocking due to online-ddl: 迁移使用 GH-ost/PT-osc 的源数据库 | PingCAP 文档中心
  2. Can you specifically describe the situation where the upstream MySQL is overwhelmed?
| username: TiDBer_BraiRIcV | Original post link

Boss, please help me with this issue. Are there any parameter adjustments that can improve write performance and thus reduce synchronization latency?

| username: buchuitoudegou | Original post link

It seems that your monitoring is performing real-time incremental verification (DM will also have related features in the future). Because DM assigns changes with the same primary key to the same worker for synchronization, this may cause some hotspot rows to experience delays. Additionally, I am not sure how you calculate the delay for several changes to the same row (for example, if a row with primary key 100 is modified twice in a short period). DM will merge these two changes into one and then synchronize it downstream, rather than synchronizing twice separately. I wonder if this situation can explain the delay fluctuations.

| username: buchuitoudegou | Original post link

Moreover, looking at the replication lag, there is almost no noticeable delay fluctuation.

| username: TiDBer_BraiRIcV | Original post link

In one of our scenarios, we have a page where a user is added, and then the page automatically refreshes to display the newly added user.

  1. Previously, we used MySQL master-slave + Atlas read-write separation. Adding a user operation (update on the master), automatic refresh display (query on the slave), and due to the low latency of MySQL master-slave, this function worked fine.
  2. Now we have changed the MySQL slave to TiDB, MySQL write + TiDB read + DM synchronization + Atlas read-write separation. With the same user addition operation, sometimes the page does not display the new user after refreshing, but after a while, the refresh shows the result. So we suspect it might be a DM synchronization delay issue.
    The test environment is in a low-peak state. It doesn’t seem like a hotspot issue.
| username: TiDBer_BraiRIcV | Original post link

The report pulled on the dashboard

| username: buchuitoudegou | Original post link

The “hotspot” here does not mean that it is bearing too much load at the same time, but rather that your test may not be accurate. For example (possibly):

  1. The write process writes 1000, and the binlog syncs to DM.
  2. The check process retrieves the current result from upstream as 1000.
  3. The write process writes a new result of 2000, and the binlog reaches DM.
  4. The check process retrieves the downstream result as 900, calculating a lag of 100.
  5. DM merges and syncs 1000 + 2000 → 2000 to downstream.

You can check the dm-worker log to see when the specific SQL was executed, which might also reveal the cause of the delay (e.g., SQL execution time is too long or the binlog processing speed is too slow).

The specific delay can actually be referenced by the replication lag indicator. For complex scenarios like yours, you might use a more comprehensive testing tool like sysbench to reproduce the situation and see if the replication lag fluctuates or remains high. If you find the delay too large or see the replication lag continuously increasing, you can increase the worker-count configuration item of syncers to improve import parallelism, but this will also put more pressure on both upstream and downstream. However, if the delay is due to high execution latency in downstream TiDB, increasing parallelism may not have much effect, so it is still necessary to determine the specific cause of the delay.

Additionally, here is the performance test report for various versions of DM for your reference:

| username: Hacker007 | Original post link

Creating a DM task can increase the number of threads.

| username: tidb狂热爱好者 | Original post link

The upstream is MySQL and the downstream is TiDB. DM is enabled for real-time synchronization. When the upstream inserts into a table and then suddenly alters the table structure with a significant change, the DM synchronization breaks. It then starts synchronizing the entire table from scratch. At this point, the upstream MySQL database experiences lag. This situation is likely to occur when the MySQL binlog reaches 3TB in a day.

| username: tidb狂热爱好者 | Original post link

DM has issues when synchronizing large amounts of data, and there have been several production incidents. If you really need to synchronize, use Alibaba’s open-source CloudCanal or DataX.

[2022/6/7 17:26]

Yes, every tool has its pitfalls, after all, MySQL and TiDB are different databases.

[2022/6/7 17:26]

Do you have any steps? Send them to me so I can learn.

[2022/6/7 17:27]

Are you talking about the pitfalls?

[2022/6/7 17:27]

The group over there is using CloudCanal.

[2022/6/7 17:30]

I mean the steps you took to fix DM, or are you now completely using CloudCanal for synchronization?

[2022/6/7 17:31]

I have multiple environments here and am still using DM. Do you want to use CloudCanal or DM?

[2022/6/7 17:31]

How did you handle the issues with DM later?

[2022/6/7 17:32]

How do you handle the order of table structure changes?

[2022/6/7 17:32]

Do you manually change the TiDB table structure? Or change MySQL’s?

[2022/6/7 17:34]

Last time DM had an issue, we skipped this table.

| username: buchuitoudegou | Original post link

Thank you for your feedback. DM does indeed cause DML blocking when synchronizing DDL. Did the DM synchronization stop because the task was paused due to an error?

| username: jerry | Original post link

Is CloudCanal a cloud product? Can it be used in an intranet environment?

| username: xiaohetao | Original post link

The compatibility between TiDB version 5 and DM is relatively poor.