Note:
This topic has been translated from a Chinese forum by GPT and might contain errors.
Original topic: TiKV 扩容过程中,Pending compaction bytes 一直在增加
[TiDB Usage Environment]
- Production, v4.0.12
[Overview] Scenario + Problem Overview
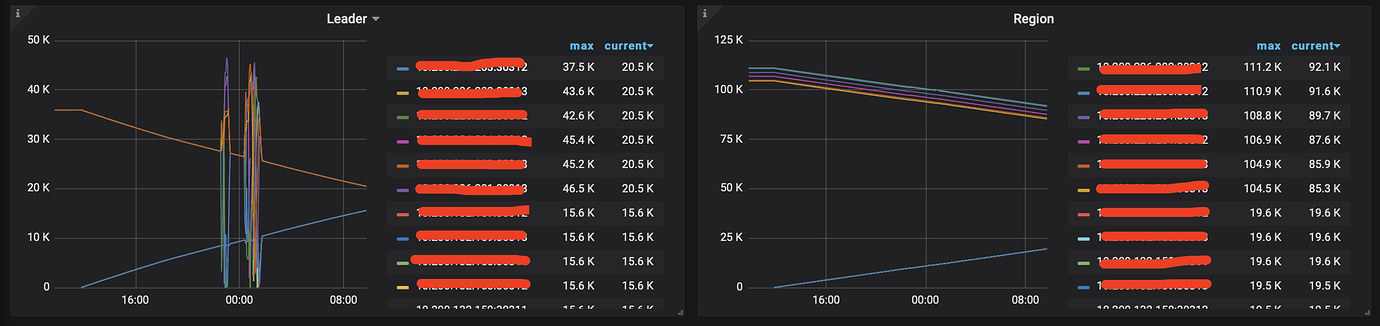
- Single
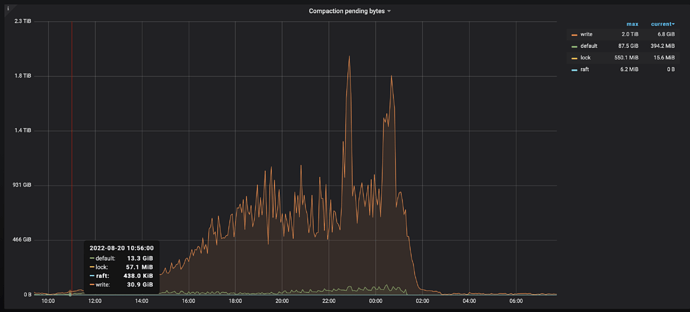
tikv region 100k, leader at 36k. During the scaling process, there were no anomalies at first. However, due to the scaling, the config was reloaded, and the alertmanager configuration was overwritten, resulting in no alerts. It wasn’t until the business side reported that the connection pool was full that we noticed the rocksdb-kv pending-compaction-bytes was continuously increasing. After exceeding the soft limit, a write stall occurred, and after exceeding the hard limit, the cluster deteriorated.
[Background] Actions Taken
-
Scaling action
tiup cluster:v1.2.3 scale-out xxx scale-out_tikv20220820.yml -i ../ssh/tiup
-
Adjusted rocksdb thread pool parameters and soft and hard pending-compaction-bytes-limit. After restarting, the situation improved, so we determined that the compaction was too slow.
rocksdb.defaultcf.hard-pending-compaction-bytes-limit: 512G
rocksdb.defaultcf.soft-pending-compaction-bytes-limit: 512G
rocksdb.writecf.hard-pending-compaction-bytes-limit: 512G
rocksdb.writecf.soft-pending-compaction-bytes-limit: 512G
rocksdb.max-background-jobs: 12
-
Some monitoring data as follows
1). TiKV-Details
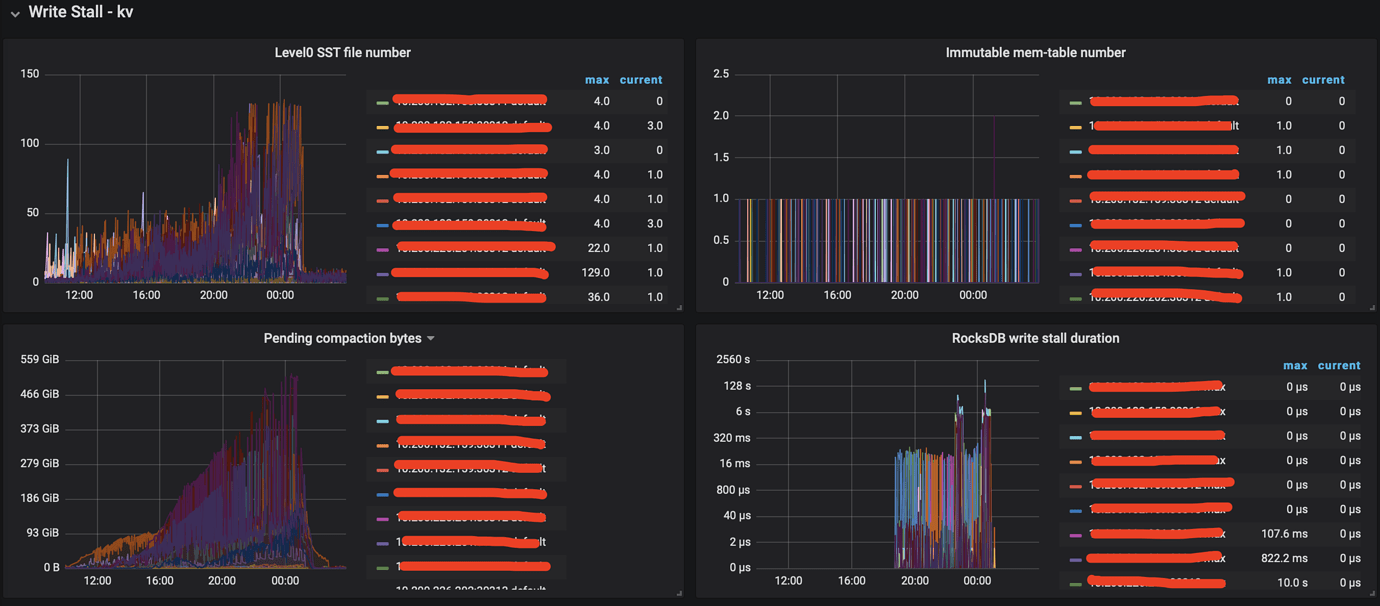
2). TiKV-Trouble-Shooting
-
Finally: I would like to ask the community experts if it is normal for pending-compaction-bytes to keep increasing during the scaling process.
It’s not quite normal. When did you expand the capacity? Generally, it is recommended to expand during off-peak business hours or when the business is stopped.
Scaling out during the lowest peak, due to too many regions, the balance time will be particularly long. Is there any way to find out the reason for the continuous increase in pending-compaction-bytes? Adjusting the limit only delays the time point of backpressure and write stall. This phenomenon disappears after restarting the cluster. Before restarting, adjusting the above parameters, from the perspective of system resource usage, IO, CPU, and memory are not maxed out.
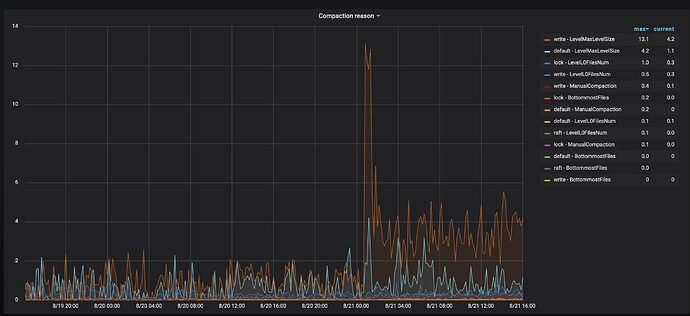
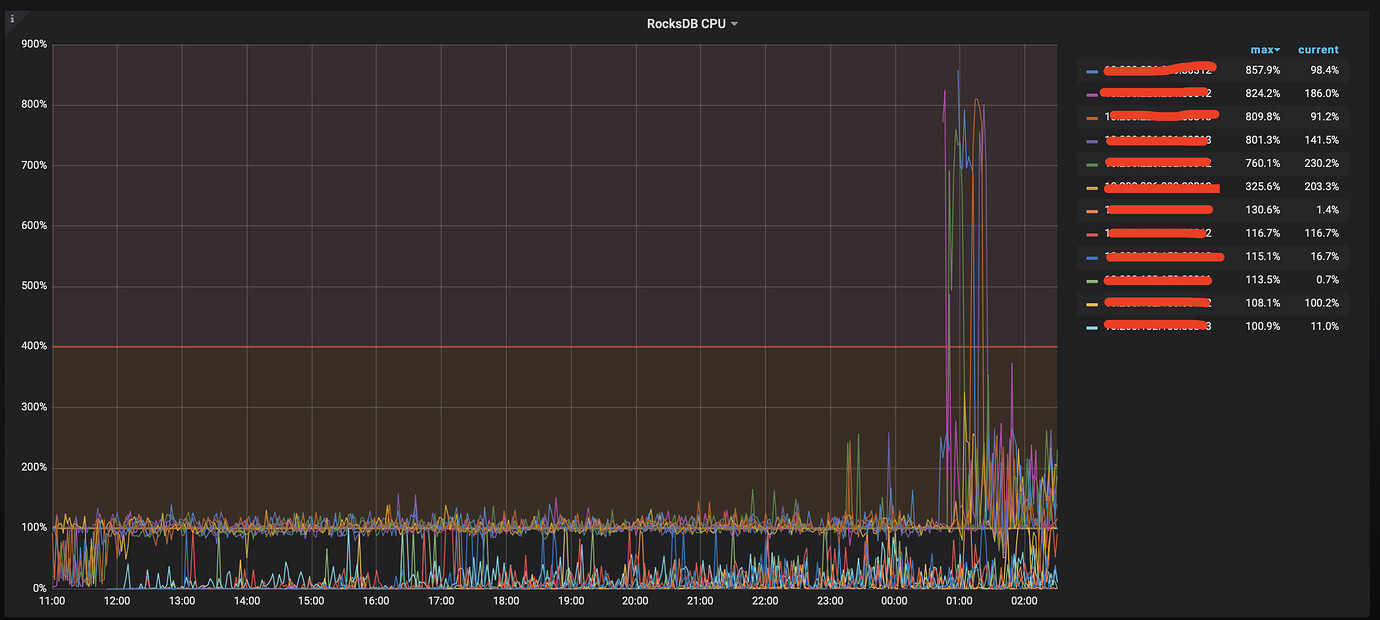
Check the compaction reason panel, the rocksdb CPU in thread CPU, and disk I/O performance.
After the restart, it looks like rocksdb cpu has increased.
There is no bottleneck in physical resources.
How about the network? What is the network I/O situation for data transmission between kv?
We have checked the system resources and network, and there is no bottleneck in this area.
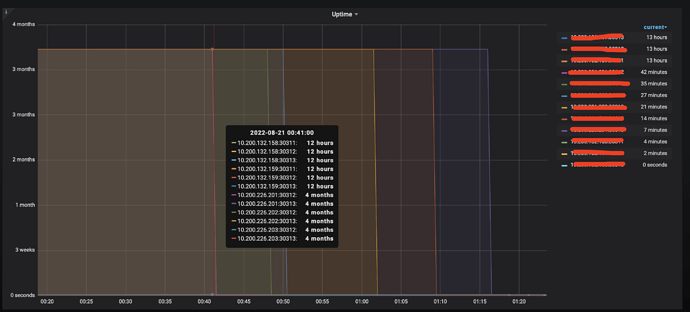
Started restarting the cluster at 0:44, but the accumulation actually began around 11:00 during the day. The write stall is a joke; it started to appear around 20:00. Have you checked if there was a large amount of data being written?
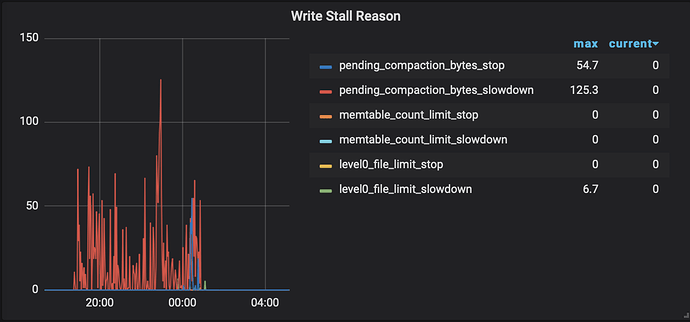
If you encounter a Write Stall, you can check the Write Stall Reason indicators in RocksDB-kv on Grafana monitoring to see which ones are not zero.
- If it is caused by pending compaction bytes, you can set
rocksdb.max-sub-compactions to 2 or 3 (this configuration indicates the number of sub-threads allowed for a single compaction job, with the default value being 3 in TiKV version 4.0 and 1 in version 3.0).
Dear community experts, let me explain my issue:
When scaling out tikv, it caused compaction pending bytes to continuously increase (starting from the scaling out), eventually triggering write stall. I have checked the physical resources, and neither io resources nor cpu resources have reached their limits. I am not sure why this would affect compaction pending bytes.
https://metricstool.pingcap.com/#backup-with-dev-tools Follow this to export the monitoring pages for overview, PD, TiKV-detail, and TiDB. Wait for all panels to expand and the data to fully load before exporting.
The panels are not expanded, and most of the data is missing. You need to wait for all the panels to expand and the data to load completely before exporting.
The time range seems to be incorrect.
I suggest looking at this reply: TiDB has many functions that set the maximum allowed CPU separately. If the overall load is not high but consistently at a certain value, it is very likely due to insufficient default parameters.
Took the monitoring time period from 2022-08-20 10:30:00-2022 to 2022-08-21 10:30:00
TiDB Monitoring.zip (6.5 MB)
It seems like certain conditions were not met previously, preventing the cleanup of some historical data. When scaling out, certain conditions were triggered, leading to a backlog of pending compacts due to the previous accumulation. Check the GC panel monitoring, and also look at which TiKV instance has a significant backlog of compact pending.