Note:
This topic has been translated from a Chinese forum by GPT and might contain errors.
Original topic: 使用数据库报错 no available connections
[TiDB Usage Environment] Production Environment
[TiDB Version] v6.1.0
[Encountered Issue: Symptoms and Impact]
Error connecting to the database: no available connections (sometimes TIKV timeout), but the cluster is normal.
Connection error:
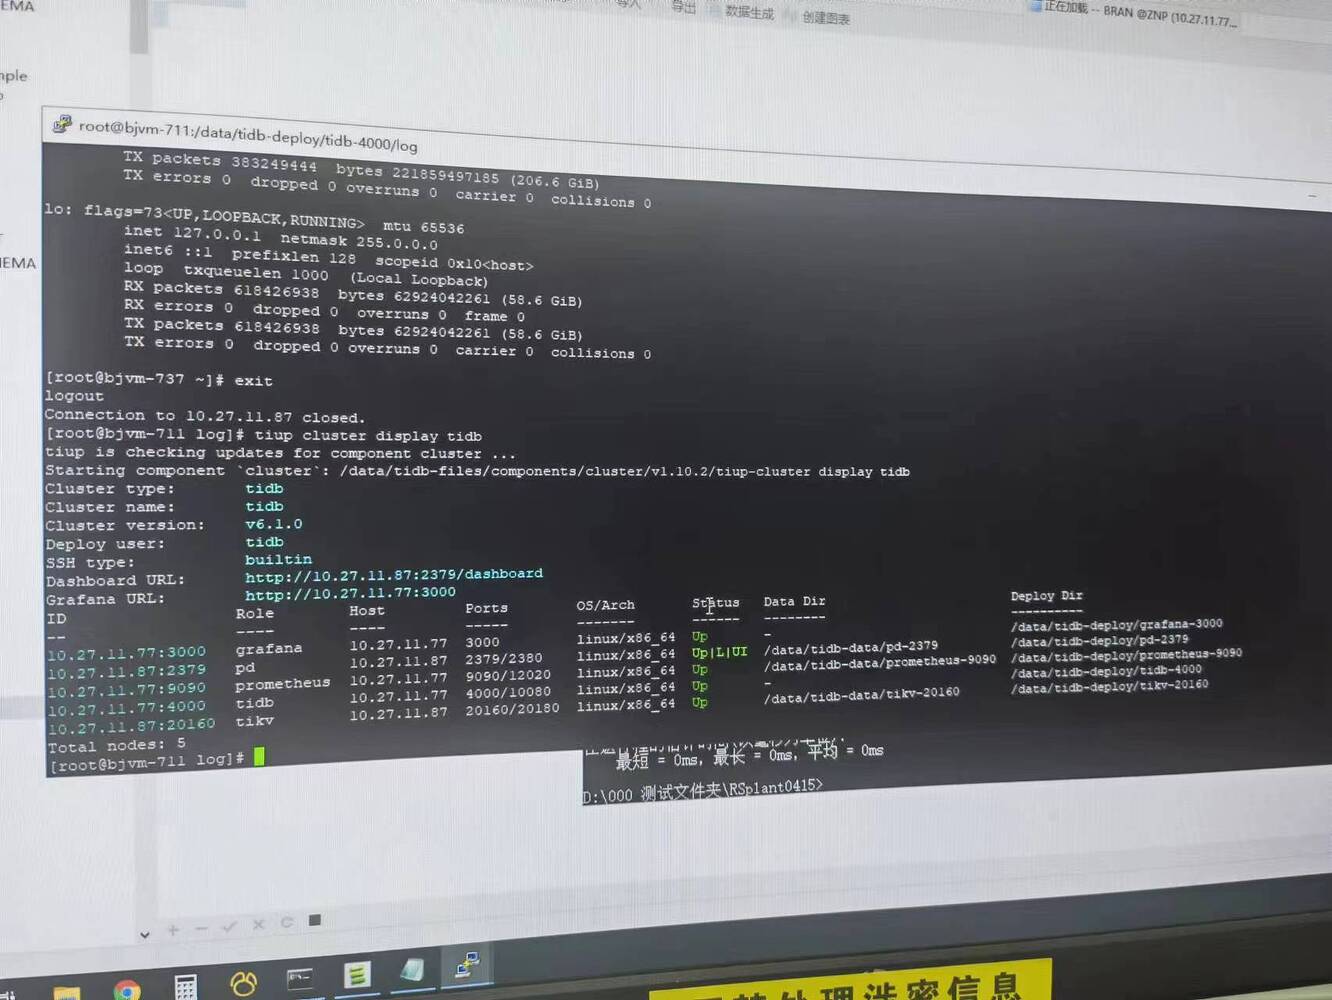
Cluster information:
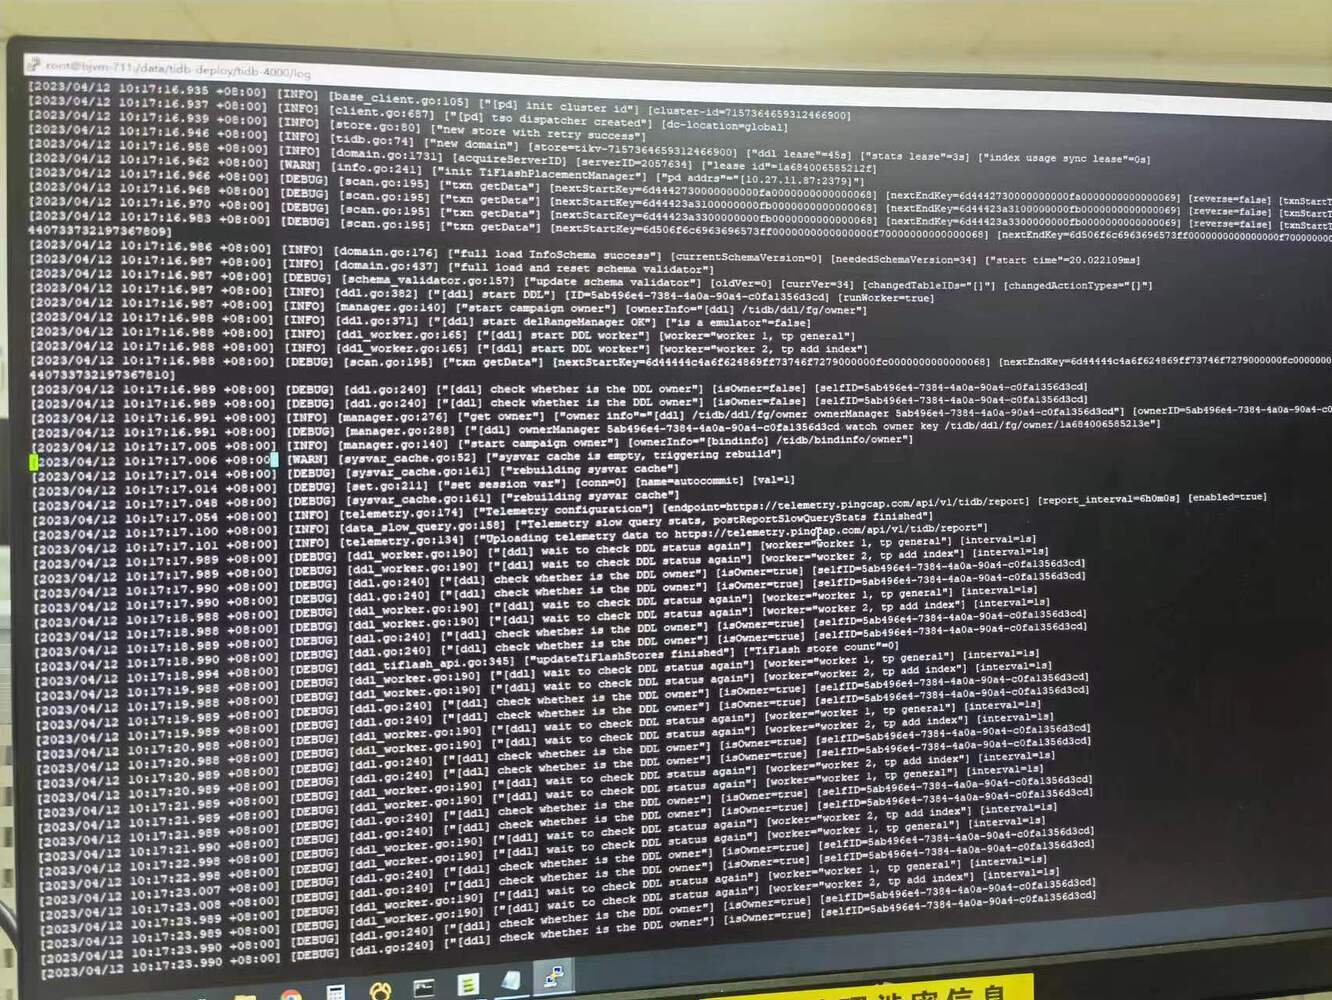
tidb.log:
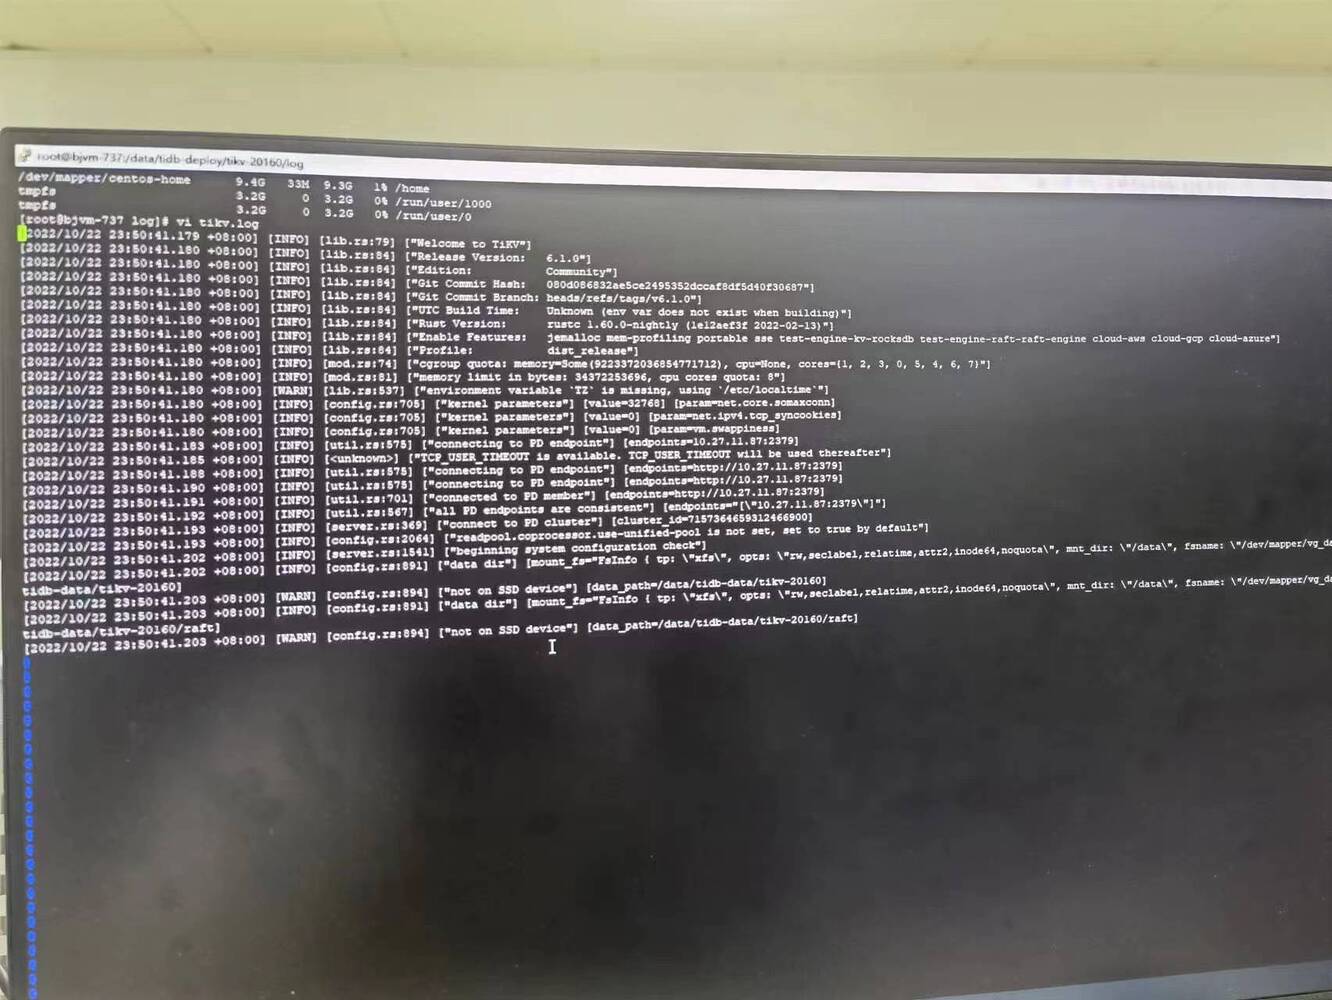
tikv.log:
This should be an error reported by the program, you can first check the connection pool configuration.
Can the MySQL command connect on a TiDB machine?
Is your cluster deployed as single nodes? Is it usable after deployment?
It was working fine after the initial deployment, but suddenly it stopped working. It’s a cluster composed of two machines.
Because the deployed machine is an intranet machine and lacks various dependencies, installing MySQL is very troublesome, so I haven’t tested it. If necessary, you can give it a try.
How do you specifically look at it? I don’t quite understand this area.
Using a direct connection to the server also results in this situation, but TiKV is on another server.
Are the resources of the TiKV host sufficient? I see that some queries can return results. Is it the larger SQL queries that can’t be executed?
Yes, it’s very likely that the load is too high, causing occasional timeouts.
Judging by the performance, is the connection pool full? How is the cluster performance?
The capacity of the disk where TiKV is located is sufficient, and I can’t even open the table using nativcat right now. This SQL isn’t large, and it used to work normally before.
Now nothing can connect at all, so the issue of high load doesn’t exist anymore, right?
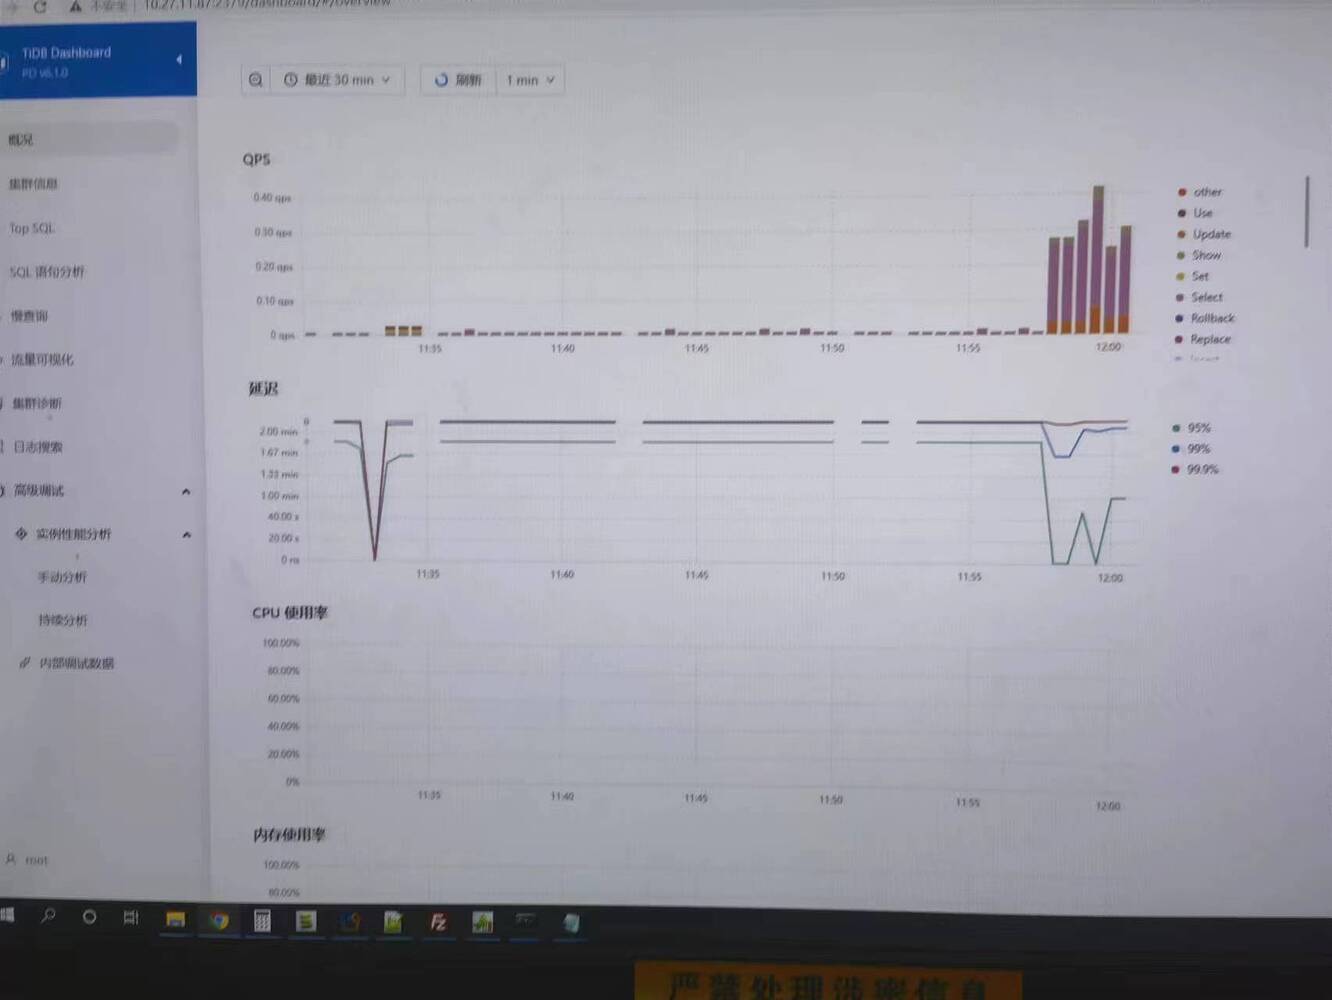
Check the load in the Dashboard.
Sorry, which one is the load? The latency displayed here is very high, but I’m not sure if it’s an issue with the cluster or the network. If it’s a network issue, besides the latency shown on this dashboard, how can I prove it’s a network problem? Because when I ping directly, the latency is less than 1ms.
Uh, is your delay 2 minutes? This definitely won’t work.
You didn’t get the CPU usage data, did you? It’s not that there’s no load, right?
Just log in to your two servers and check the load situation. You can use top or dstat.
See where it’s slow; normally, the latency should be less than 100ms.
Here are the CPU usage rates for the two servers. Although one has a higher usage rate, it is not the TiKV server. Additionally, I don’t know why the first machine has so many PD-servers and TiDB-servers, and I don’t dare to stop them since this is a production environment.
With Grafana, you can extract several items from the Grafana overview interface.
PS: Deploying only one TiKV in a production environment is highly discouraged; the minimum recommendation is three TiKVs.
Sorry, Grafana is too professional for me, I don’t know how to use it or add an overview. Although there is only one TiKV in the current environment, more will be added later.