Note:
Original topic: TIDB单服务器部署tiflash失败
Single server deployment test, the memory should be sufficient, the CPU supports AVX2, the ports do not appear to be occupied, but TiFlash just won’t start.
Could you post the logs? Are there any errors?
There should be logs. There is an issue with your “more” command.
Check the TiFlash related startup logs with systemctl.
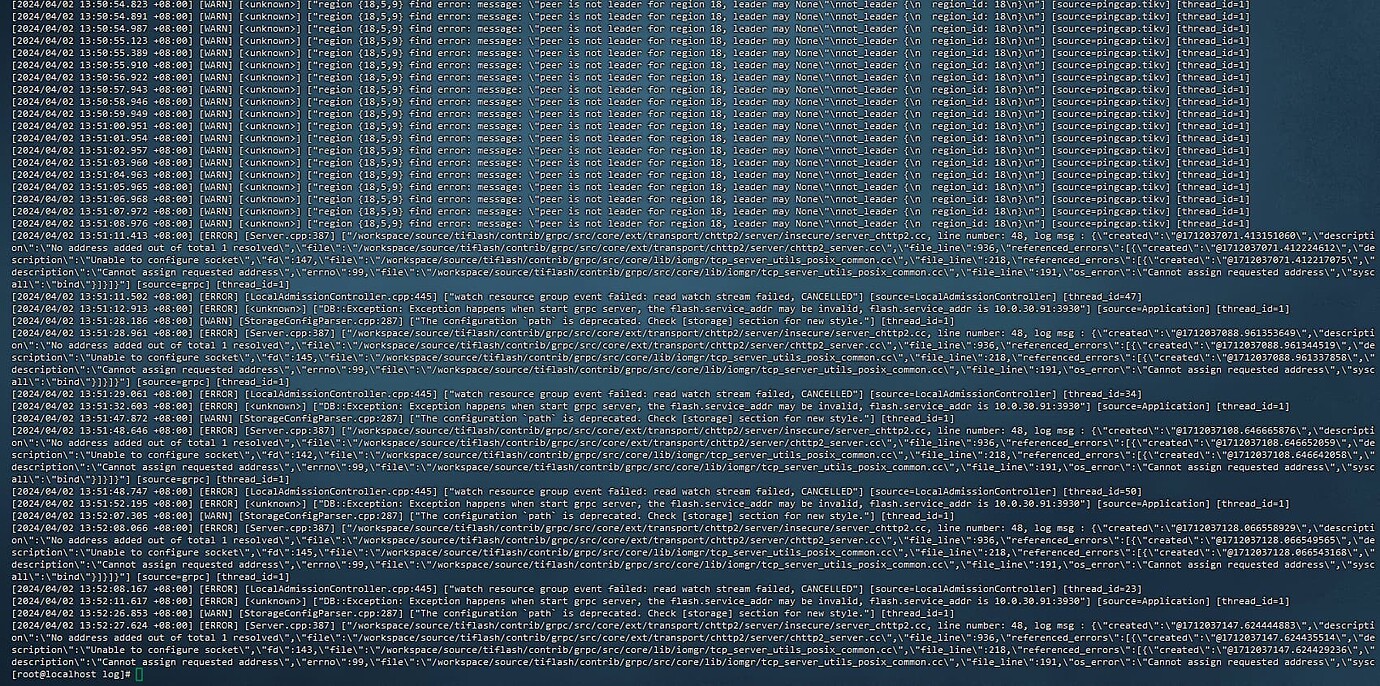
Sorry, the previous method of checking the logs was incorrect. Here is the error log.
Sorry, the previous method of checking the logs was incorrect. Here are the logs:
It seems difficult to find the leader, but the TiKV cluster is all normal.
Check if port 3930 is being used.
Check if there are any processes occupying this address?
I checked with netstat -tuln | grep 3930, and there is no process occupying it.
Are they all single instances?
Could you share the topology?
No, all components are deployed on a single server.
了解如何快速上手使用 TiDB 数据库。
Please send the configuration file. Maybe it’s not configured correctly.
global:
monitored:
server_configs:
pd_servers:
tidb_servers:
tikv_servers:
host: 10.0.30.91
host: 10.0.30.91
host: 10.0.30.91
tiflash_servers:
monitoring_servers:
grafana_servers:
Are you running so many services on a single machine with 16GB of memory? I suggest using tiup playground for testing. It’s quite normal that you can’t start so many services…
It looks like there’s still 6.5G of free memory.
Can you check the system logs at /var/log/message?
There are a bit too many services. Check the system logs for any OOM errors during that time.