Note:
This topic has been translated from a Chinese forum by GPT and might contain errors.
Original topic: tiup升级3.0.8到4.0.6 node_exporter stop失败
【TiDB Usage Environment】Production
【TiDB Version】Upgraded from 3.0.8 to 4.0.6
【Encountered Issue】Failed to stop node_exporter-9100.service: Unit node_exporter-9100.service not loaded
failed to stop: 10.9.137.108 node_exporter-9100.service, please check the instance’s log() for more detail.:
timed out waiting for port 9100 to be stopped after 2m0s
【Reproduction Path】tiup cluster upgrade
【Problem Phenomenon and Impact】
Check the logs of the node 10.9.137.108 to see what the issue is that is preventing the node exporter from starting.
This is a problem caused by Prometheus.
time=“2022-09-23T08:55:12+08:00” level=info msg=" - tcpstat" source=“node_exporter.go:97”
time=“2022-09-23T08:55:12+08:00” level=info msg=" - textfile" source=“node_exporter.go:97”
time=“2022-09-23T08:55:12+08:00” level=info msg=" - time" source=“node_exporter.go:97”
time=“2022-09-23T08:55:12+08:00” level=info msg=" - timex" source=“node_exporter.go:97”
time=“2022-09-23T08:55:12+08:00” level=info msg=" - uname" source=“node_exporter.go:97”
time=“2022-09-23T08:55:12+08:00” level=info msg=" - vmstat" source=“node_exporter.go:97”
time=“2022-09-23T08:55:12+08:00” level=info msg=" - xfs" source=“node_exporter.go:97”
time=“2022-09-23T08:55:12+08:00” level=info msg=" - zfs" source=“node_exporter.go:97”
time=“2022-09-23T08:55:12+08:00” level=info msg=“Listening on :9100” source=“node_exporter.go:111”
node exporter has also started:
tidb 4050 0.5 0.1 115600 16380 ? Ssl 08:55 0:07 bin/node_exporter --web.listen-address=:9100 --collector.tcpstat --collector.systemd --collector.mountstats --collector.meminfo_numa --collector.interrupts --collector.vmstat.fields=^.* --log.level=info
Was TiDB previously deployed using TiUP? If not, an environment migration with Ansible would be necessary.
Previously used ansible, switched to tiup for upgrades; does ansible environment migration refer to importing configurations?
I have imported it, and now the node_exporter is actually up, but the entire upgrade process is not complete, and the version still shows 3.0.8.
Complete log during upgrade:
Stopping component node_exporter
Stopping instance 10.9.99.96
Stopping instance 10.9.137.108
Stopping instance 10.19.100.221
Stopping instance 10.9.16.130
Stopping instance 10.9.48.230
Stopping instance 10.9.14.188
Stopping instance 10.9.130.145
Stopping instance 10.9.175.106
Stop 10.9.48.230 success
Failed to stop node_exporter-9100.service: Unit node_exporter-9100.service not loaded.
Failed to stop node_exporter-9100.service: Unit node_exporter-9100.service not loaded.
Stop 10.19.100.221 success
Error: failed to stop: 10.9.99.96 node_exporter-9100.service, please check the instance’s log() for more detail.: timed out waiting for port 9100 to be stopped after 2m0s
Is there any missing topology information when importing Ansible’s topology information into TiUP?
After importing, can tiup take over and control the TiDB cluster normally?
For example, using tiup to stop the cluster service and then start the cluster service, etc.
During the tiup upgrade process, pd/tidb/tikv all completed the upgrade and restart normally, and tiup cluster display also shows normal:
10.9.137.108:9093 alertmanager 10.9.137.108 9093/9094 linux/x86_64 Up /home/tidb/deploy/data.alertmanager /home/tidb/deploy
10.9.48.230:8249 drainer 10.9.48.230 8249 linux/x86_64 Up /home/tidb/deploy/data.drainer /home/tidb/deploy
10.9.137.108:12379 pd 10.9.137.108 12379/12380 linux/x86_64 Up /home/tidb/deploy/data.pd /home/tidb/deploy
10.9.14.188:12379 pd 10.9.14.188 12379/12380 linux/x86_64 Up|UI /home/tidb/deploy/data.pd /home/tidb/deploy
10.9.175.106:12379 pd 10.9.175.106 12379/12380 linux/x86_64 Up|L /home/tidb/deploy/data.pd /home/tidb/deploy
10.19.100.221:9090 prometheus 10.19.100.221 9090 linux/x86_64 Up /home/tidb/deploy/prometheus2.0.0.data.metrics /home/tidb/deploy
10.9.48.230:8250 pump 10.9.48.230 8250 linux/x86_64 Up /home/tidb/deploy/data.pump /home/tidb/deploy
10.9.130.145:4000 tidb 10.9.130.145 4000/10080 linux/x86_64 Up - /home/tidb/deploy
10.9.16.130:4000 tidb 10.9.16.130 4000/10080 linux/x86_64 Up - /home/tidb/deploy
10.9.99.96:4000 tidb 10.9.99.96 4000/10080 linux/x86_64 Up - /home/tidb/deploy
10.9.130.145:20160 tikv 10.9.130.145 20160/20180 linux/x86_64 Up /home/tidb/deploy/data /home/tidb/deploy
10.9.16.130:20160 tikv 10.9.16.130 20160/20180 linux/x86_64 Up /home/tidb/deploy/data /home/tidb/deploy
10.9.99.96:20160 tikv 10.9.99.96 20160/20180 linux/x86_64 Up /home/tidb/deploy/data /home/tidb/deploy
So what else is the problem? 
The upgrade process has not been completed, and the version number has not been updated: Cluster version: v3.0.8
There is no data in this part of the monitoring:
Try scaling down Prometheus first, then attempt the upgrade.
If it’s a production environment, I would suggest setting up another instance and migrating the data over.
I checked the upgrade logs, and the machine that reported the error does not have the above logs, giving the impression that the stop command was not initiated to the target machine.
Additionally, there are issues with scaling down Prometheus before upgrading, but after scaling it back up, the data appears in the chart above.
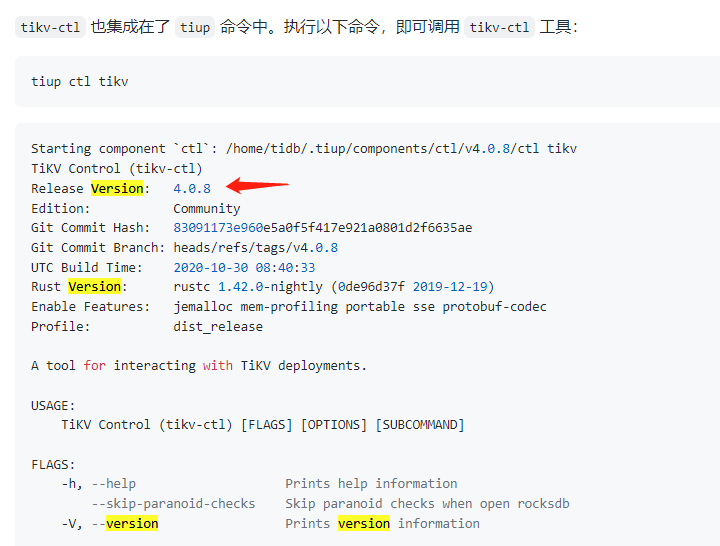
Use tiup to check the cluster version. If the version is still 3.0.8, you need to check each node to see which one hasn’t been successfully upgraded.
Additionally, you can verify the version effectively using the CLI commands on each node, for example:
Hello, I encountered the same issue when upgrading the TiDB cluster from 5.1.1 to 6.1.1, specifically the “failed to stop node_exporter-9100.service” error. At that time, I noticed that TiDB/PD/KV had all been upgraded, but the display did not show the latest version number. This cluster was not set up using Ansible, and I couldn’t find the cause. I temporarily resolved it as follows:
tiup cluster upgrade cluster_name v6.1.1 --offline
ansible -i ansiblehost.txt all -m shell -a 'sudo systemctl daemon-reload & sudo systemctl start node_exporter-9100.service'

