Note:
This topic has been translated from a Chinese forum by GPT and might contain errors.
Original topic: Tidb频繁oom大佬帮我分析下SQL
[TiDB Usage Environment] Production Environment
[TiDB Version]
Cluster version: v5.4.3
[Encountered Problem: Phenomenon and Impact]
Recently, due to business changes, queries have caused frequent OOM on TiDB nodes, with severe memory usage.
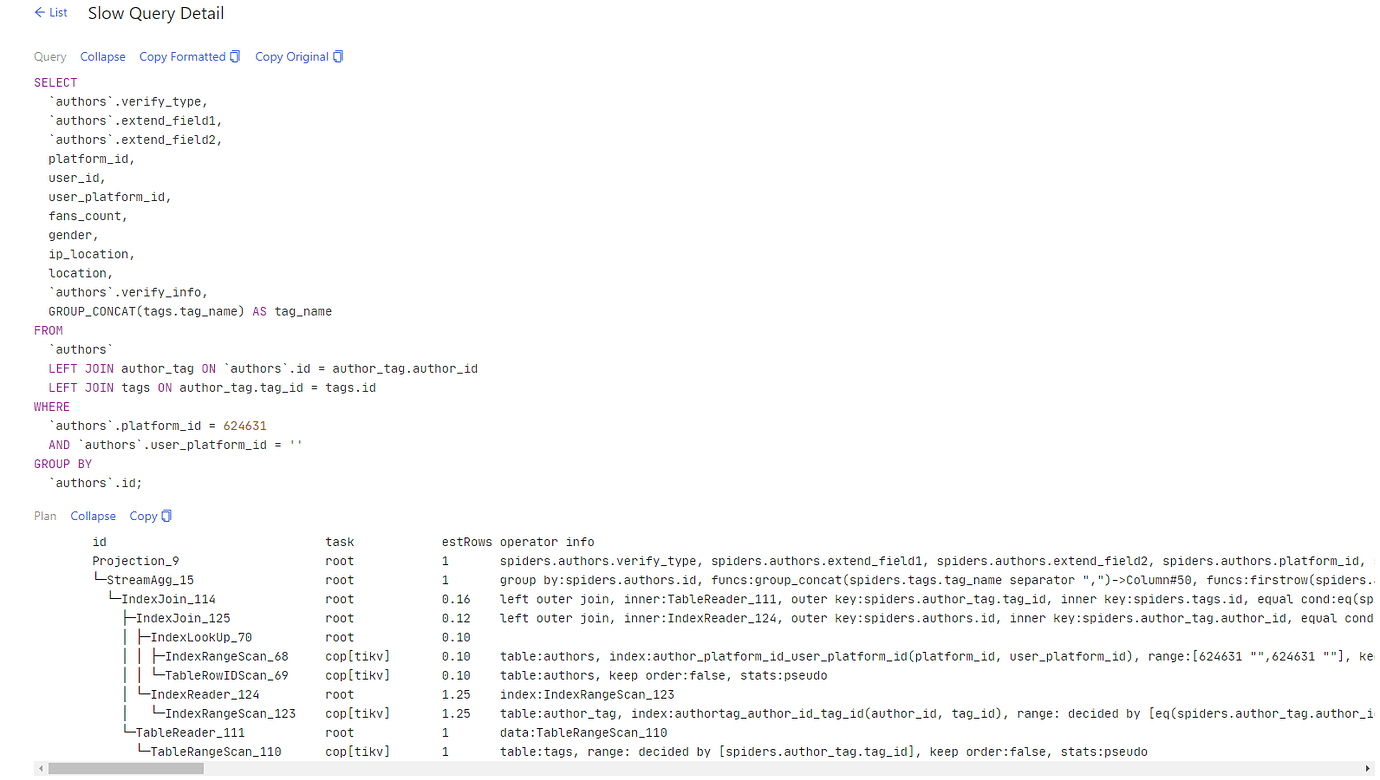
I don’t understand SQL optimization very well, can someone help me analyze if there’s any issue with the SQL?
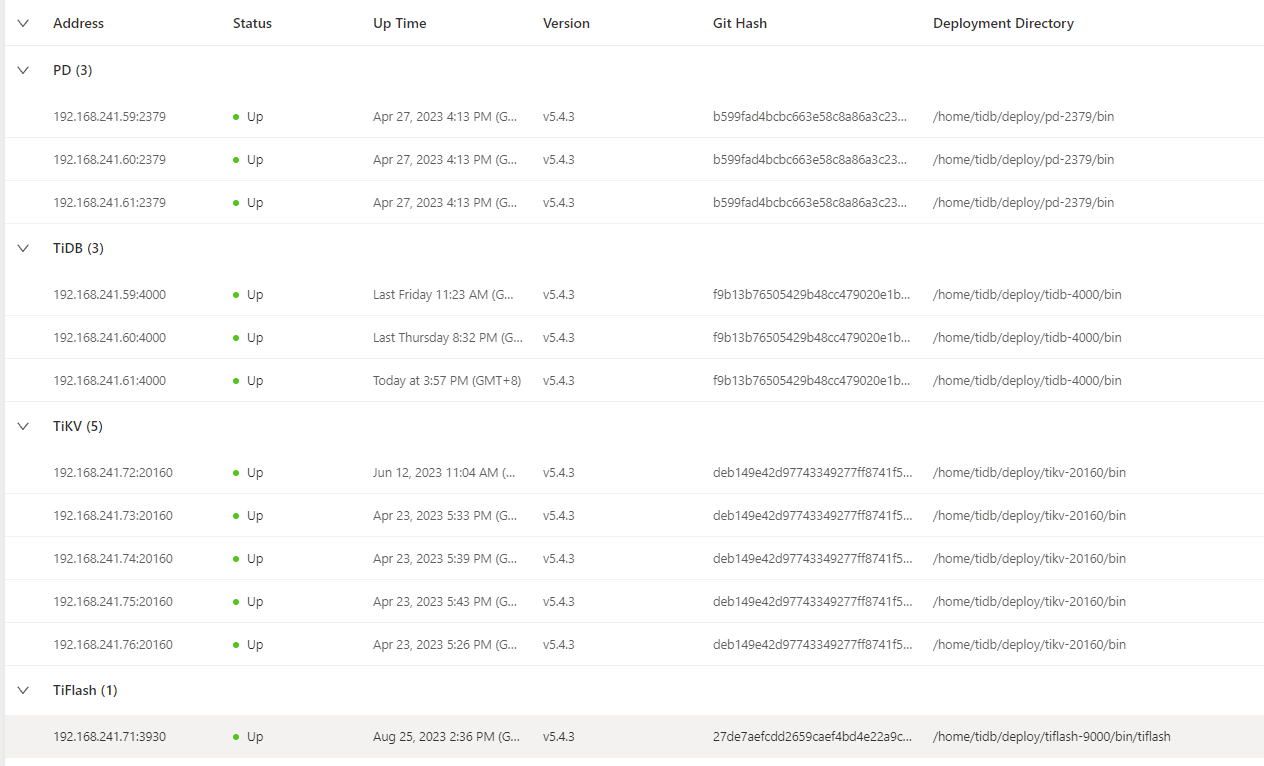
[Resource Configuration] Go to TiDB Dashboard - Cluster Info - Hosts and take a screenshot of this page
[Attachments: Screenshots/Logs/Monitoring]
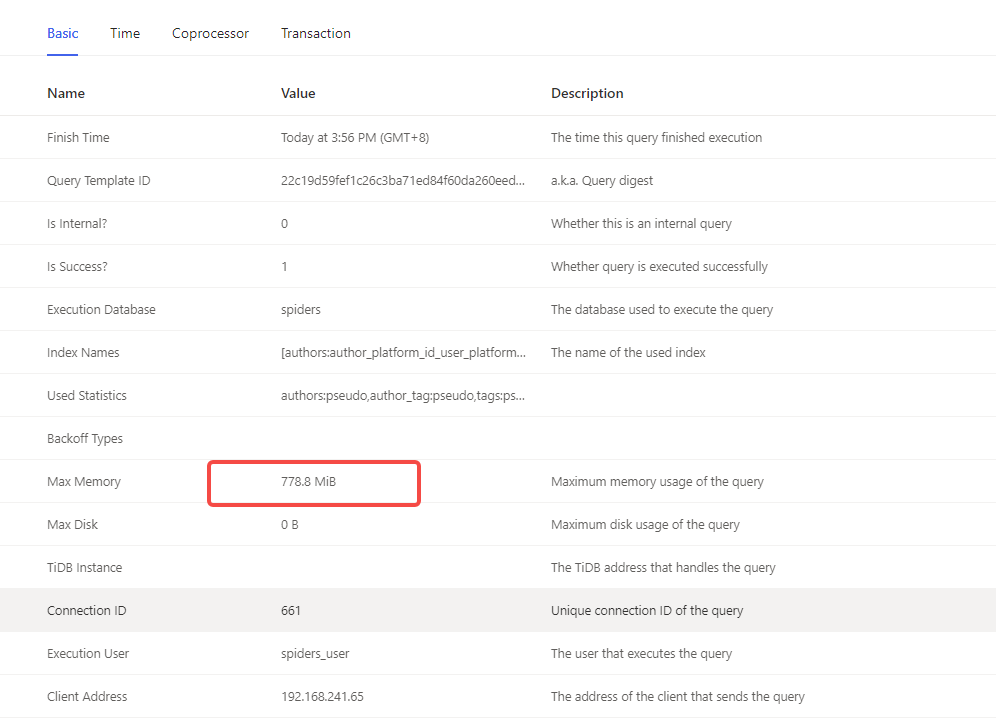
The following is a SQL that consumes a lot of memory found in the TiDB Dashboard. Is the 778M memory consumption of this SQL problematic? Is this SQL causing frequent OOM due to insufficient memory?
For troubleshooting, you should check the topsql at the time of the OOM to see which SQL statements are consuming more resources. To prevent the system from becoming unavailable due to OOM, you need to limit the maximum memory for each query.
The statistics are outdated, you can collect them first and take a look. Pull the execution plan back, and you can see the actual actrows.
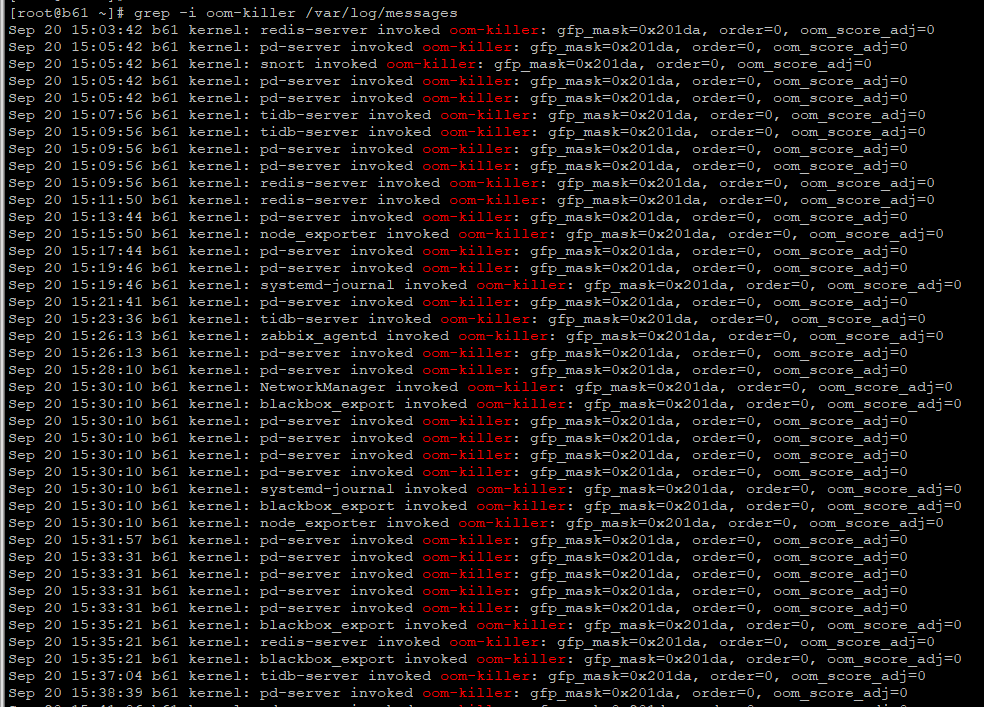
Why has your PD been selected by the OOM-killer more times than TiDB? The most ridiculous thing is that even zabbix_agentd has been selected. I remember this zabbix process uses no more than 100M of memory. I can’t understand how it could be selected by the OOM-killer.
It should be caused by insufficient memory, all the above processes have been killed~
It seems that there might not be enough memory, causing various processes to compete for memory, and some processes triggered the OOM killer. 
What are the specifications of your servers?
First, take a look at this under memory constraints, and then optimize the slow SQL queries one by one:
It really shouldn’t be.
The oom_score of TiDB
[root@tidb1 ~]# cat /proc/20428/oom_score
559
The oom_score of PD
[root@tidb1 ~]# cat /proc/17744/oom_score
52
I also have TiDB and PD on the same server. Normally, the score of PD is much lower than that of TiDB. It shouldn’t be selected by the oom-killer so frequently.
I checked, and it’s all this SQL. A lot of queries are occupying 1.6 GiB, which is larger than the 778M I mentioned above.
I had already changed the memory limit for a single SQL to 3G before, and I’m afraid reducing it further might affect normal business operations.
An SQL query of 1.6G, no amount of memory is enough. So, it’s still necessary to optimize the SQL. Is there still room for optimization in the SQL statement I mentioned above? Can it use less memory?
An SQL query of 1.6G is too many requests. The priority doesn’t make much sense anymore. Just kill them all. There’s also a single-point Redis above that should be killed too.
Indeed. I thought it was a hardware issue.
You deployed it on one machine.
Given limited resources, I run TiDB and PD on the same node.
What I’m thinking now is to try executing this SQL with TiFlash and see what happens.
The main reason for high memory usage is that the aggregation is happening on TiDB. It would be best to push down this aggregation. By doing it on TiFlash, TiDB can directly receive the results.
Redis should stay out of this, just switch to another machine…