Note:
This topic has been translated from a Chinese forum by GPT and might contain errors.
Original topic: grafana Connection Count 显示错误
[TiDB Usage Environment] Production Environment
[TiDB Version] v5.4.0 v6.5.0
[Encountered Issue: Phenomenon and Impact]
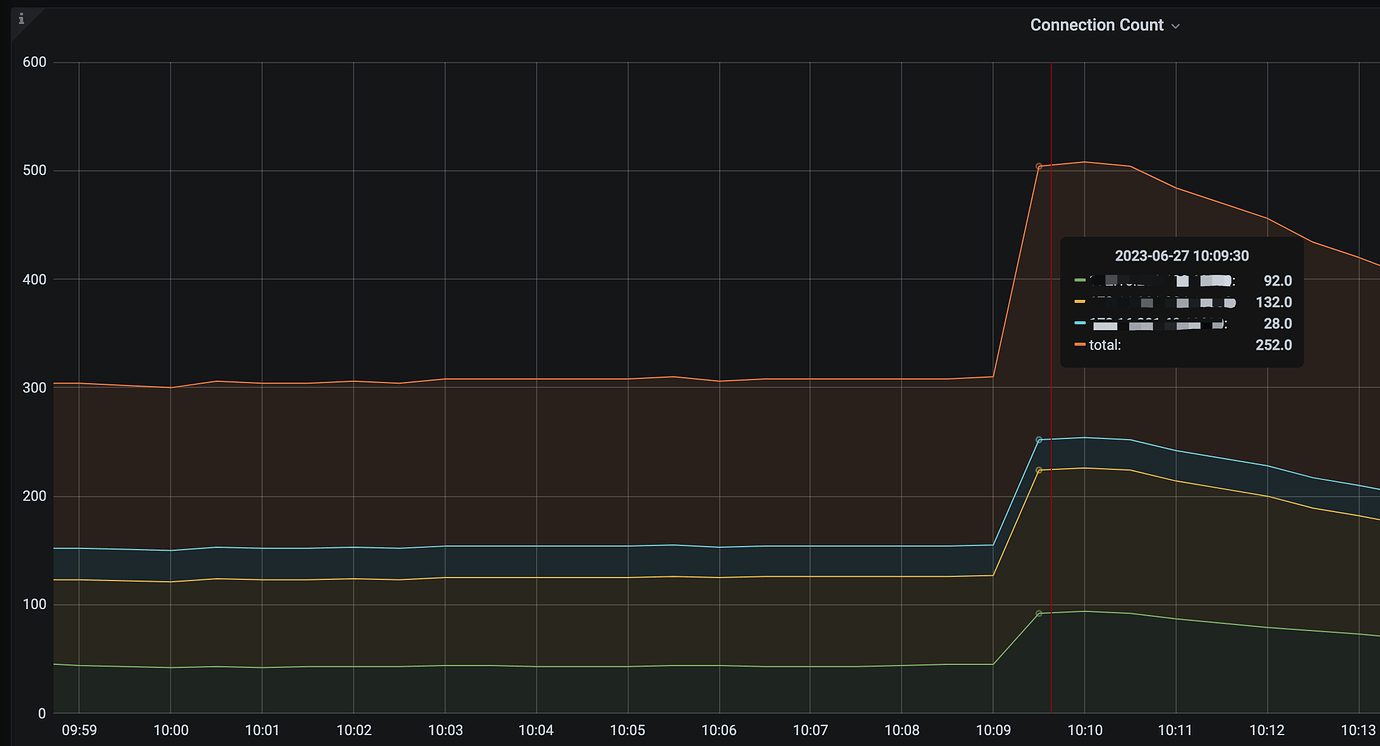
The built-in Grafana TiDB-Summary → Connection Count is not displaying accurately.
Incorrect panel
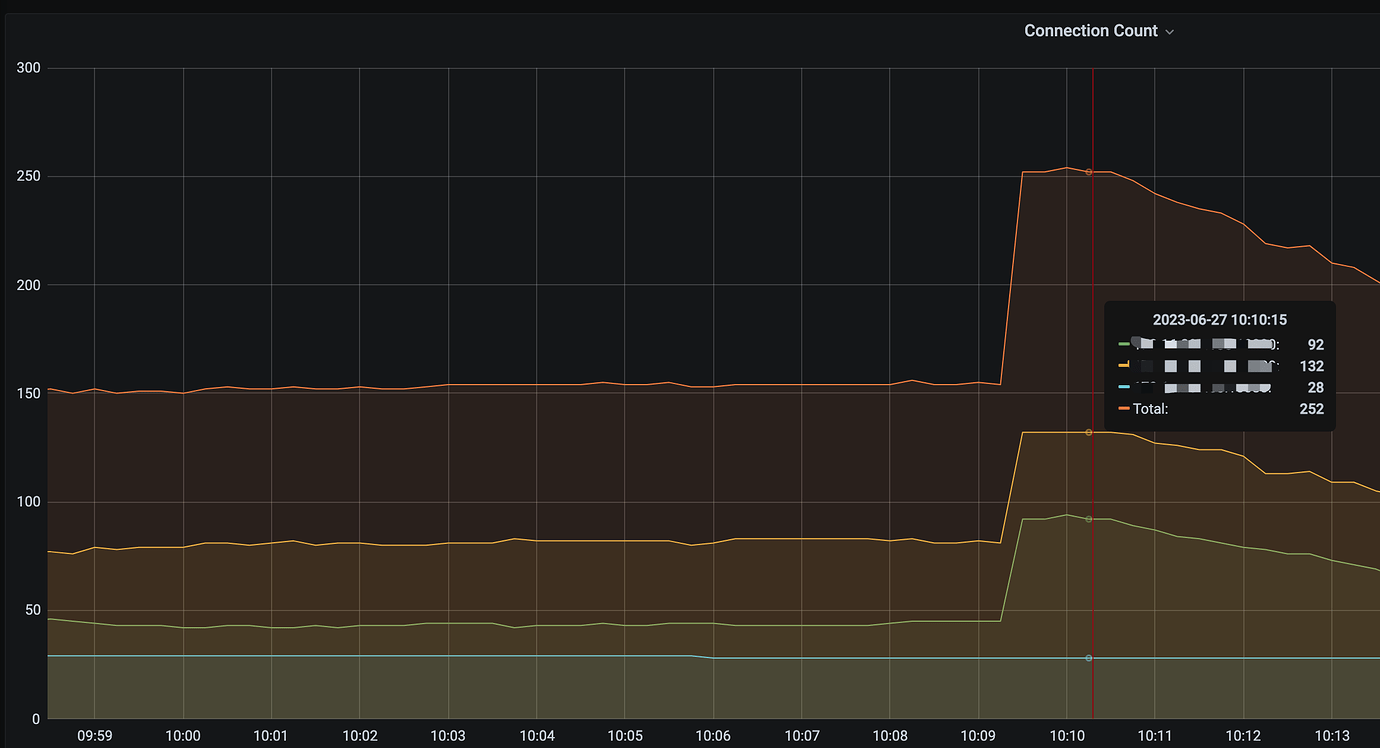
Correct panel (self-added)
Isn’t this the same? Do you mean the issue is with the number format?
It doesn’t match the values on the y-axis.
Your left Y-axis does have an issue, but mine is fine…
I checked another version v6.5.0 and it is the same.
It looks like it’s duplicated.
I also found that TiDB->Server->Connection Count is not accurate.
Found the issue, enabled Stacking and null value, not sure what applicable scenarios this has.
This topic was automatically closed 60 days after the last reply. New replies are no longer allowed.