Note:
This topic has been translated from a Chinese forum by GPT and might contain errors.
Original topic: grafana监控面板显示磁盘空间有为0 的时候
[TiDB Usage Environment] Production Environment / Testing / PoC
[TiDB Version]
[Reproduction Path] What operations were performed when the issue occurred
[Encountered Issue: Phenomenon and Impact]
[Resource Configuration]
[Attachment: Screenshot/Log/Monitoring]
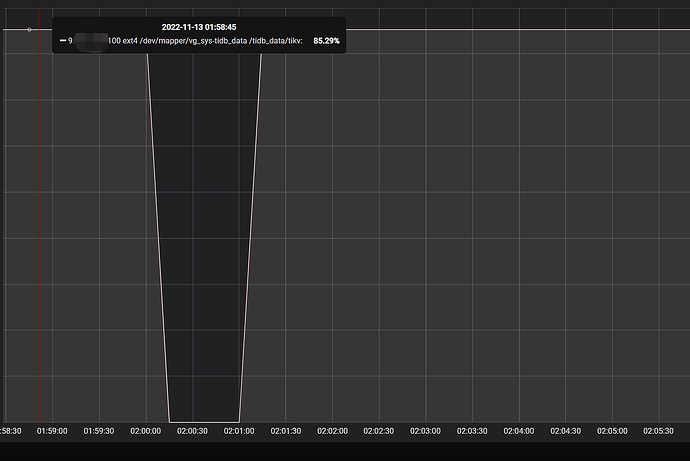
Upon checking the monitoring, it was found that the disk space usage rate was 0 at 2 AM in the past 30 days. Checking the TiKV node status showed no restarts, and no error logs were found in the TiKV logs. However, the system logs revealed:
It seems like this situation might be due to no data being collected, hence showing 0, right? Has anyone encountered this situation before?
Connection refused likely means it didn’t connect and didn’t retrieve any data.
Showing as 0 doesn’t necessarily mean it is actually 0; it could be that no data was collected. Do you have other monitoring tools? You can compare them bi-directionally.
Other monitoring items are normal, but it’s very strange that there is an issue with data collection almost every day at 2 AM. I don’t know where to start troubleshooting. I checked Prometheus and there are no obvious errors.
Yes, the TiKV nodes appear normal and haven’t restarted. I’m not sure where the issue is occurring or where to start troubleshooting.
Check if there are any scheduled tasks at these two points? For example, backups, collecting statistics, or other business-related tasks? Also, take a look at the slow SQL in the dashboard during this time period?
I checked, and there is a scheduled backup task that starts at 00:00 and basically ends around 00:30. The statistics information is from 00:00 to 06:00 every day. I didn’t find any other anomalies.
Check if there are any anomalies with the machine, such as network jitter or other issues, that could have caused the machine to be unresponsive at that time, resulting in the exporter being unable to collect data.

