Note:
This topic has been translated from a Chinese forum by GPT and might contain errors.
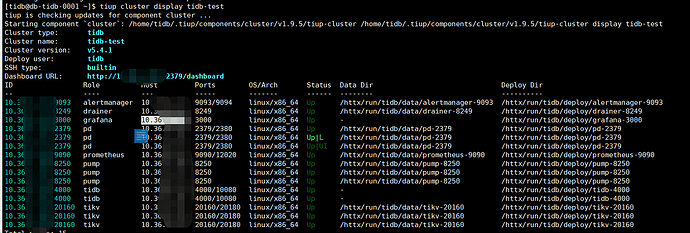
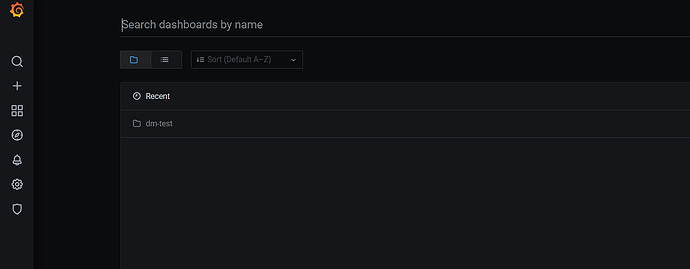
Original topic: grafana 监控 突然没有集群信息了,前几天机器被重启过, 如何再生成集群监控信息
[Test Environment] Testing environment
[TiDB Version]
[Encountered Issues]
[Reproduction Path] The machine was restarted a few days ago
[Problem Phenomenon and Impact]
Grafana monitoring suddenly has no cluster information. The machine was restarted a few days ago. How to regenerate cluster monitoring information?
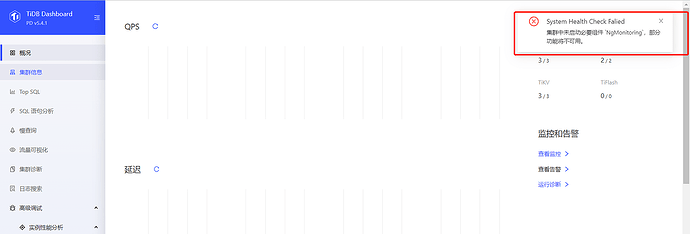
The dashboard also indicates that the component is not started.
I have figured out the issue with dasshbroad. Can someone help with the Grafana issue?
The issue has been resolved. Reloaded and restarted Grafana.
Have you modified any parameters in Grafana? Why does it work fine after reloading?
No parameters were modified.
Reload means reloading the configuration and making it effective. From the handling method, it seems that the parameters have become invalid, the configuration hasn’t been changed, and the monitoring suddenly stopped collecting information; is there a bug in the monitoring?
Well, I don’t know. Anyway, I checked and didn’t change anything.
Have you ever adjusted or modified the .tiup directory and its subdirectories or files (such as modifying file contents, renaming directories, or moving them to other locations)?
You can follow this post.
How does your Grafana display information about dm-test? Are you sharing it with DM?
It’s gone after reloading.
Could you share your YAML configuration file for us to take a look?
This topic was automatically closed 60 days after the last reply. New replies are no longer allowed.


