Note:
This topic has been translated from a Chinese forum by GPT and might contain errors.
Original topic: Grafana 展示cpu 显示nodata
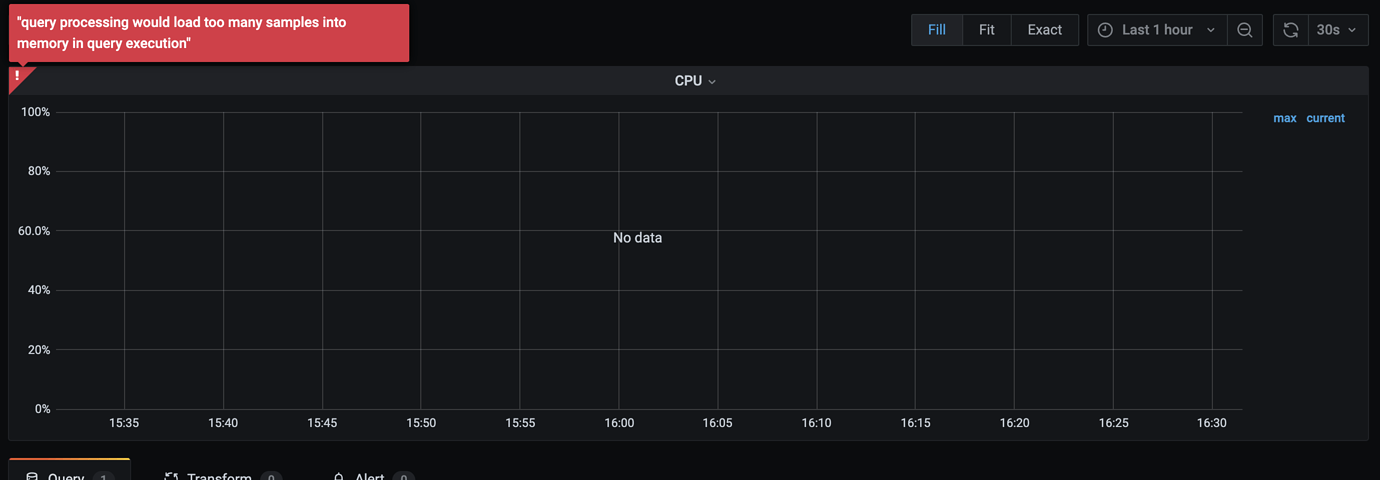
Monitoring path: overview → tikv → cpu
Version: 5.0.4
Installation method: tiup installation
Issue: When checking the CPU usage of each instance, I found “nodata” and the following prompt:
"query processing would load too many samples into memory in query execution"
Try running tiup cluster reload xxx -R prometheus and check the load on the monitoring machine.
After the restart, it did not take effect.
The load on the monitoring machine is relatively low.
PS: In the usage environment, replace IP with hostname, and other monitoring metrics can display the corresponding hostname.
sed -i.bak -e "s/172.0.0.1\b/hostname1/g" -e "s/172.0.0.2\b/hostname2/g" prometheus.yml
Please share the Prometheus logs.
Did you modify the default Prometheus configuration provided by TiDB?
Thank you, the issue has been resolved.
This topic was automatically closed 1 minute after the last reply. No new replies are allowed.