Note:
This topic has been translated from a Chinese forum by GPT and might contain errors.
Original topic: (大佬求救,毕设相关) Prometheus、Granafa的Cluster-Overview以及Dashboard的p99延时不同
[TiDB Usage Environment] Test/PoC
[TiDB Version]
[Reproduction Path] What operations were performed when the issue occurred
[Encountered Issue: Issue Phenomenon and Impact]
[Resource Configuration]
[Attachments: Screenshots/Logs/Monitoring]
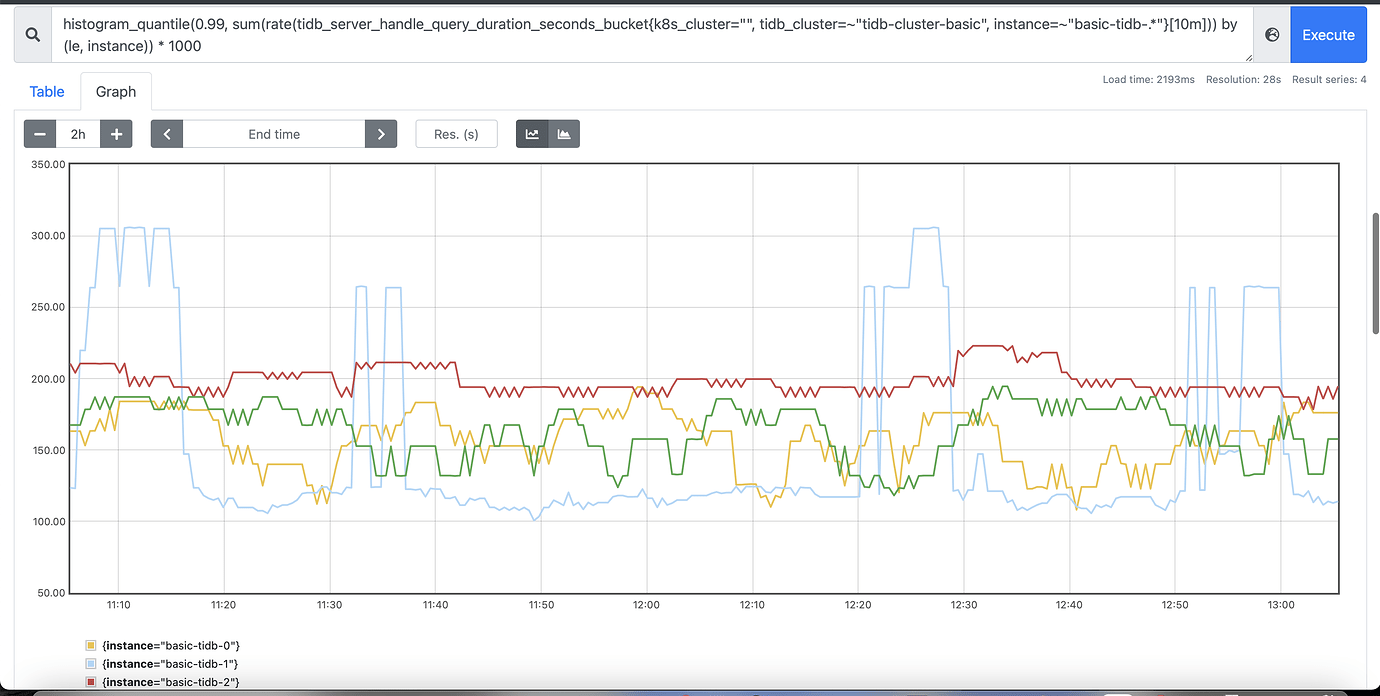
P1: Prometheus query of p99 latency graph for tidb pod:
Question: Currently, there is no load, so why is the latency still spiking to around 200ms? Theoretically, shouldn’t it be 0ms?
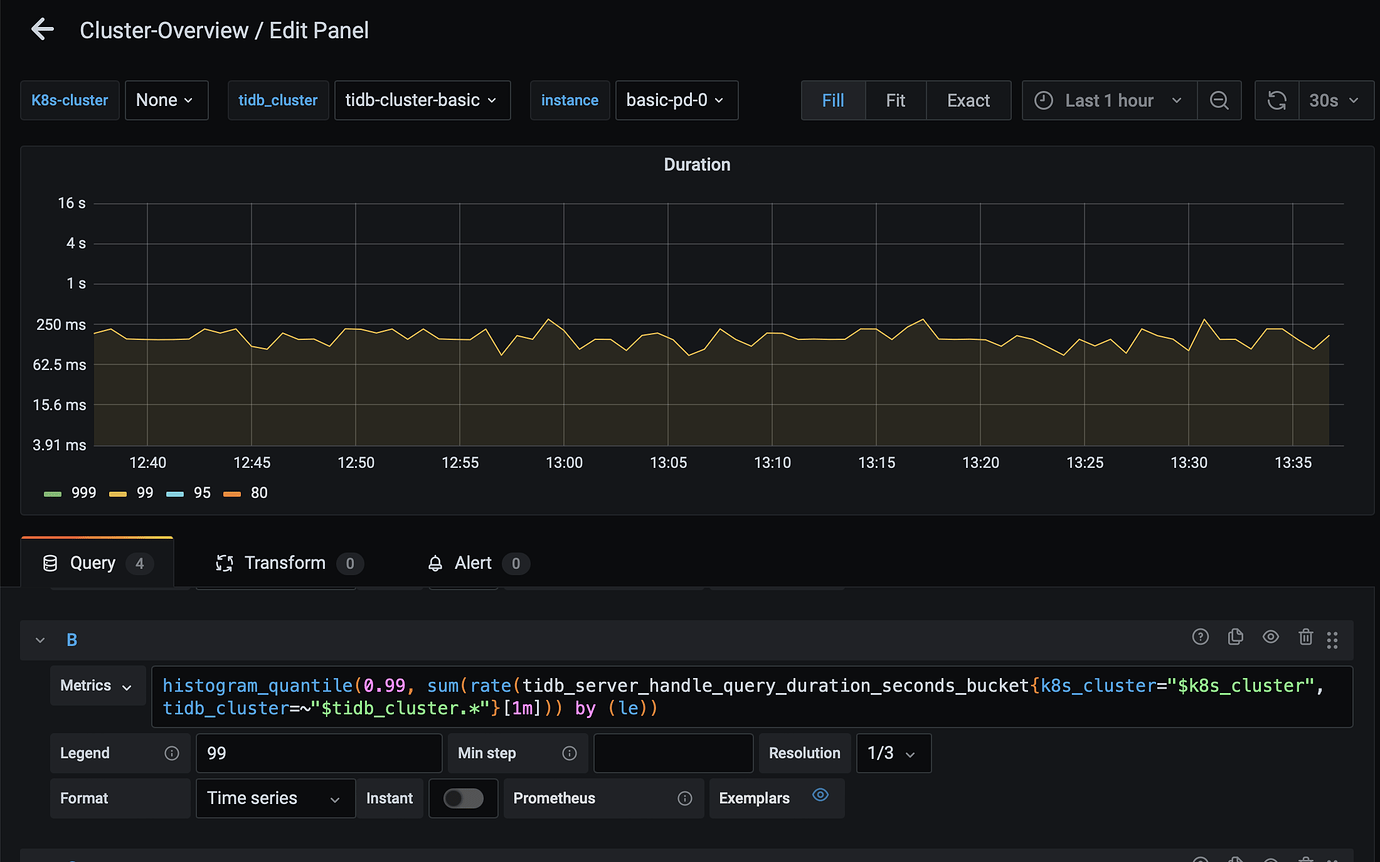
P2: p99 latency graph for tidb pod under Granafa’s Cluster-Overview
This seems to combine the p99 latency curves of multiple pods into one. Question: Currently, there is no load, but the latency is still over 200ms? Theoretically, shouldn’t it also be 0ms?
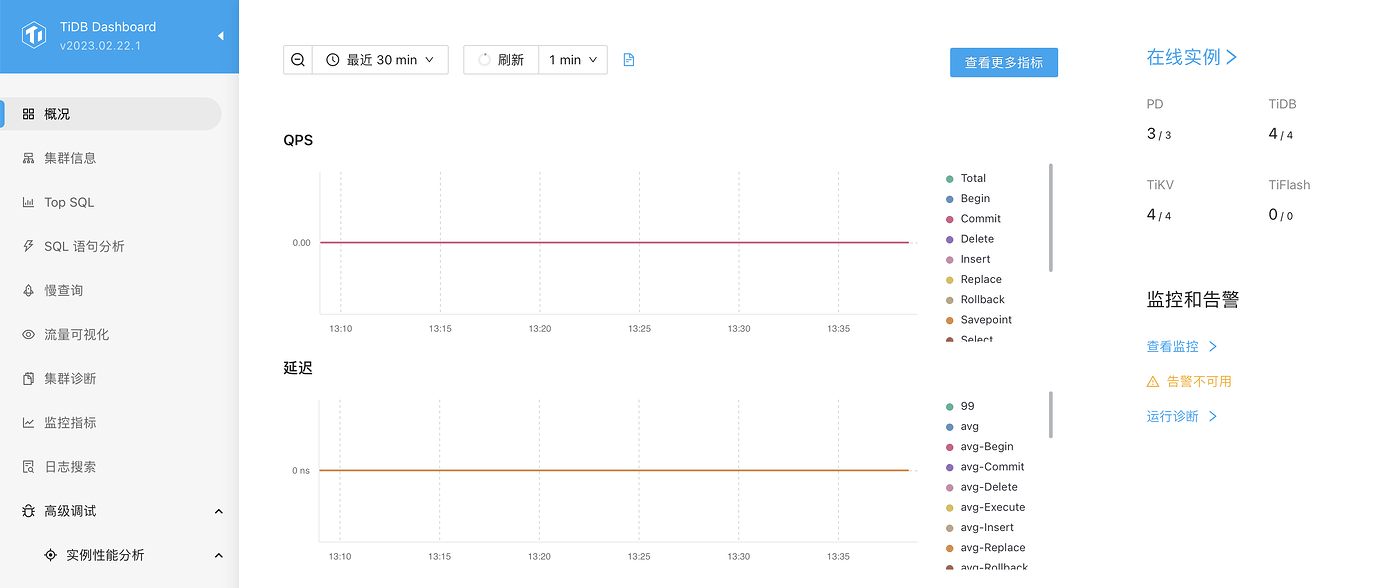
P3: p99 latency graph on the Dashboard control panel
This looks normal. Currently, there is no load, and its latency curve is also 0ms, which is consistent with theoretical expectations.
Can any experts explain the differences between these three?
I want to get the latency data of P3 by writing code. How should I write it?
There are internal SQLs in the cluster, see if they can be filtered out. It is estimated to be affected by this.
So, can I directly get data from the dashboard through code?
When you enter the dashboard to query with an empty cluster, you also use TiDB, and the SQL on the dashboard page is basically slow SQL.
The latency on the dashboard indeed only appears when there is a load. I think it is very difficult to filter out internal cluster SQL to get the real business SQL latency, right?
Fetching data from the dashboard is essentially retrieving data from Prometheus. You can access Prometheus’s API using PromQL. As for filtering out the internal SQL latency of the cluster to obtain the actual business latency, this requirement is not highly necessary in real business scenarios. Internal SQL within the cluster usually accounts for a small proportion, and during busy business periods, P99/P999 can effectively show the current latency situation.
The topic I am currently working on is greatly affected by tail latency. Therefore, this data noise must be cleaned up. My P1 is to access Prometheus’s API through promql. If I were to write it into the code, it would also be that promql query statement. Do you have a better way to get data like the dashboard? Or do you know what promql the dashboard uses to get data from Prometheus?
Try filtering out “internal”.
Could you provide more details?  I’m currently a complete beginner, just starting to learn TiDB. I’m working on building an intelligent elastic scaling system based on TiDB, and the tail latency metric is very important.
Is it written like this? It seems feasible?
It should be written like this.
This topic was automatically closed 60 days after the last reply. New replies are no longer allowed.