Note:
This topic has been translated from a Chinese forum by GPT and might contain errors.
Original topic: tikv 节点 unified read pool CPU轮流高问题
[TiDB Usage Environment] Production Environment
[TiDB Version] v6.5.3
[Reproduction Path]
[Encountered Problem: Phenomenon and Impact]
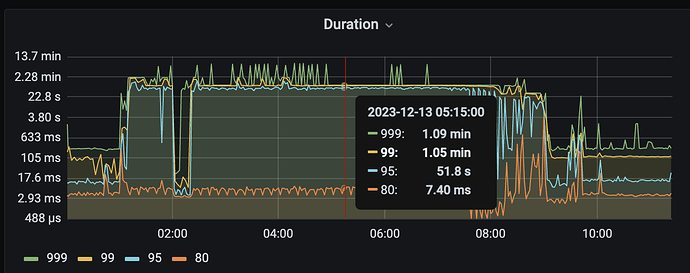
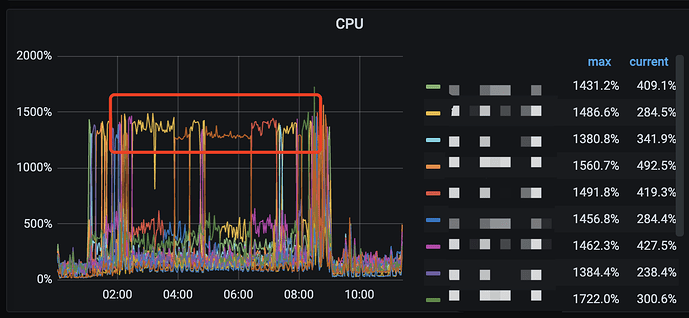
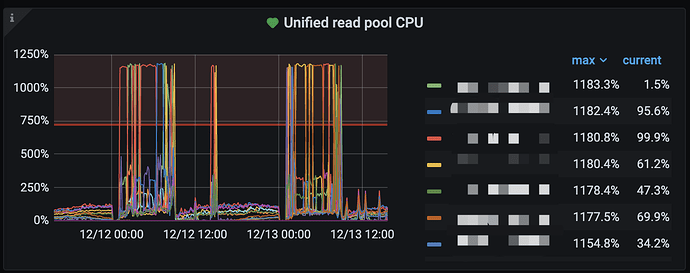
After upgrading from v5.1.4 to v6.5.3, the query tasks in the early morning have high latency. Both the slow query logs and monitoring show that the CPU of the unified read pool in TiKV is fully utilized. However, not all TiKV instances experience high CPU usage simultaneously; instead, it occasionally spikes on certain machines.
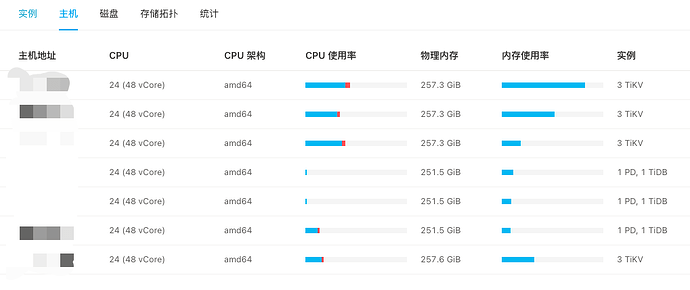
[Resource Configuration] Go to TiDB Dashboard - Cluster Info - Hosts and take a screenshot of this page
Restart TiKV, ignoring resource usage for now.
[Attachments: Screenshots/Logs/Monitoring]
KV nodes take turns with high CPU usage.
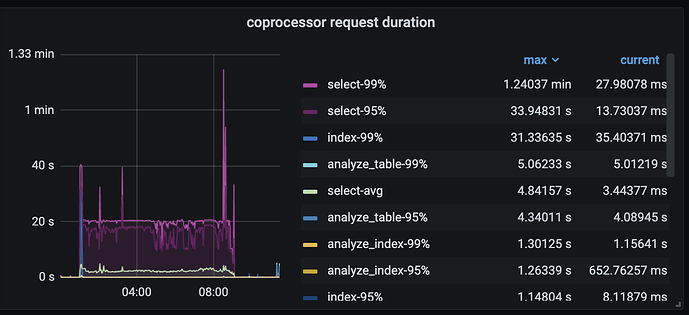
Coprocessor
The unified read pool is configured with 12 threads, all of which are fully utilized.
The SQL statement has been confirmed to use the index in the execution plan. It returns quickly during working hours, but it gets stuck for a long time when running tasks in the early morning. The analyze table command was executed on 12/13, and TiKV was reloaded on 12/13 to see if there is any improvement on the early morning of 12/14.
Open the dashboard and check the top SQL during that period to see what the top SQL for this node is. It looks like a read hotspot.
Was there any batch processing during that time period? Check the disk I/O.
That’s it, just optimize the SQL.
Check the LEADER of TIKV, it might be unbalanced or there might be a query hotspot causing the issue.
PS: The original poster and I are in the same department. Last night, we enabled the readpool.unified.auto-adjust-pool-size switch, and the performance improved significantly. Our analysis suggests that this is because the SQL queries are mostly concurrent and identical:
SELECT `t1`.`id`, `t1`.`ber`, `t1`.`type` FROM `ber` AS `t1` WHERE (`t1`.`id` > 6379887) ORDER BY `t1`.`id` LIMIT 1000;
Therefore, they should all be executed on the same KV, leading to a hotspot issue. Today, we are setting up Follower Read to see if it can alleviate the problem.
tidb7.5.
I tried the following on a partitioned table with 180 million rows:
WHERE (t1.id > 6379887) ORDER BY t1.id LIMIT 1000
The execution plan is as shown above, and the speed is quite fast. It shouldn’t cause a large-scale scan on TiKV, which would lead to the unified read pool CPU being fully utilized.
I feel that if your SQL execution is slow or scans a lot of data, it might still be an issue with the execution plan.
There is no problem just looking at the execution plan. During the time when the issue occurred, we also saw this execution plan.

You can’t just make guesses. Go to the slow query log and look for the SQL statements with a high number of key scans around the time of the issue.
Check the TPS and QPS for that time period.
