Note:
This topic has been translated from a Chinese forum by GPT and might contain errors.
Original topic: 单个TiKV节点CPU高,请问大佬们怎么处理
【TiDB Environment】Testing
【TiDB Version】v6.5.3
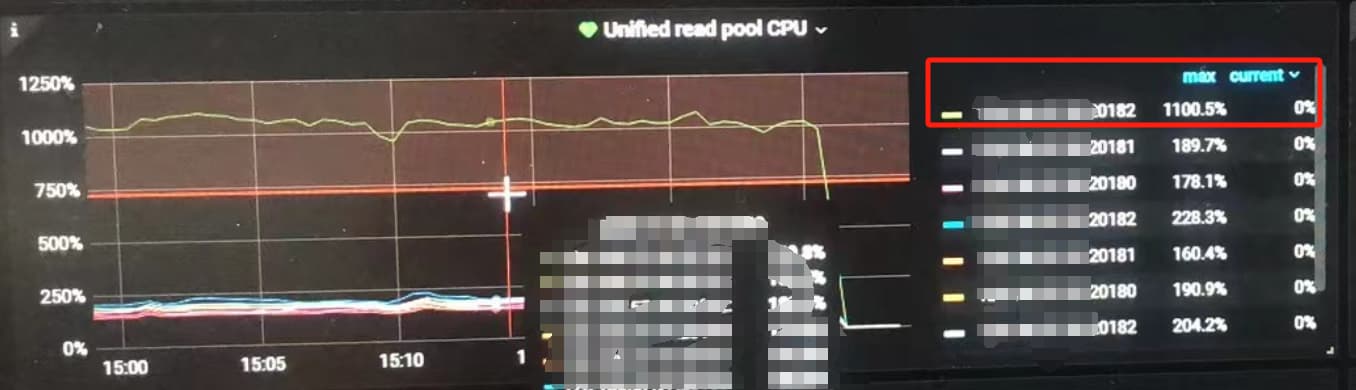
The CPU usage of a single TiKV component is relatively high.
The monitoring charts are as follows:
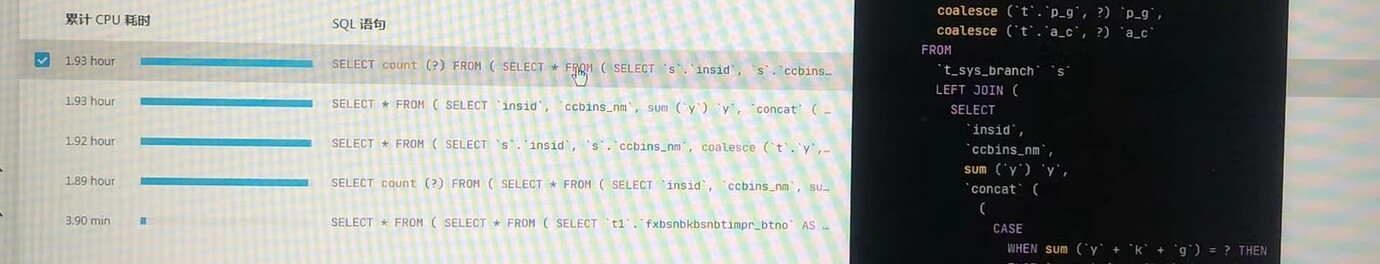
The involved SQL is as follows:
The read thread pressure is too high. First, try to optimize the SQL, and then see if you can split the region and distribute it to other nodes.
It feels like the slow queries need to be optimized.
It’s obviously a slow query, please optimize it.
Okay, I’ll try to optimize these SQL queries first and see.
This is very likely a slow query. The region involved is on one KV. Is it a hotspot? Check the heatmap.
Optimize poorly performing SQL
It could be a hotspot issue. Check the traffic visualization menu in the dashboard monitoring chart to see if there are any particularly bright lines.
This parameter “s” was turned off and then turned on. Currently, it has decreased a lot, but there is still a slight difference. It can only be resolved from the SQL side.
 Your SQL looks just like ours, using list query pagination, first querying the total count, then querying the first page. We are also very troubled by this. There’s no other way but to optimize the SQL, or when querying the total count, specify a separate SQL to reduce unnecessary field queries. However, this requires support in the program implementation.
This topic was automatically closed 60 days after the last reply. New replies are no longer allowed.