Note:
This topic has been translated from a Chinese forum by GPT and might contain errors.Original topic: TIDB Coprocessor 执行耗时高
To improve efficiency, please provide the following information. Clear problem descriptions can be resolved faster:
[TiDB Usage Environment]
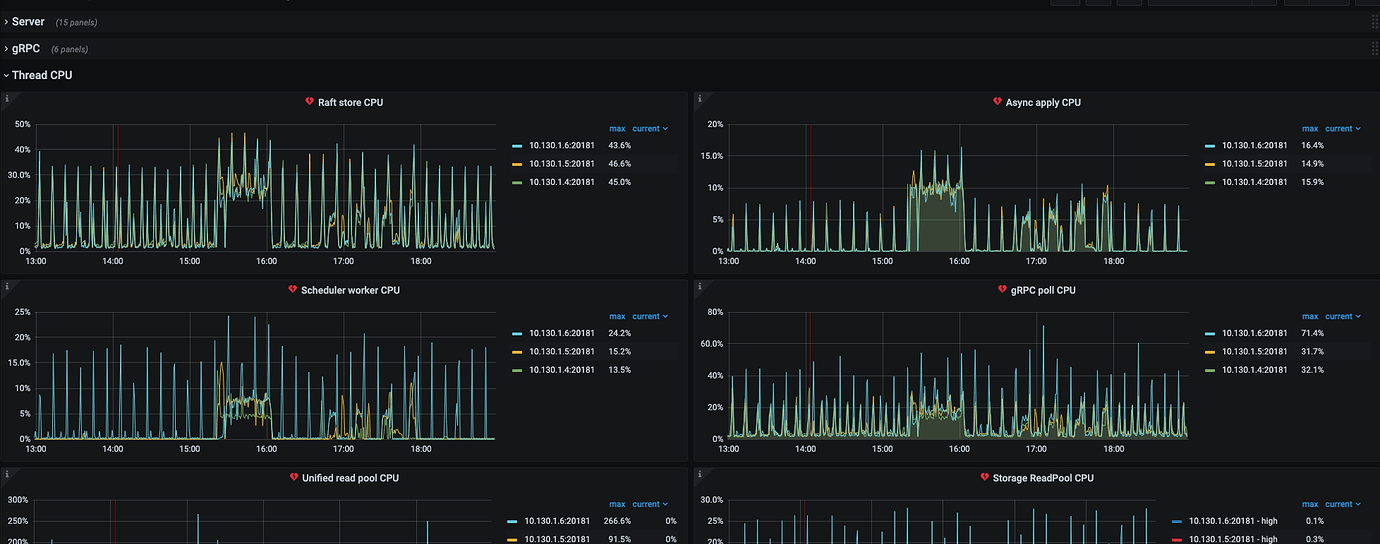
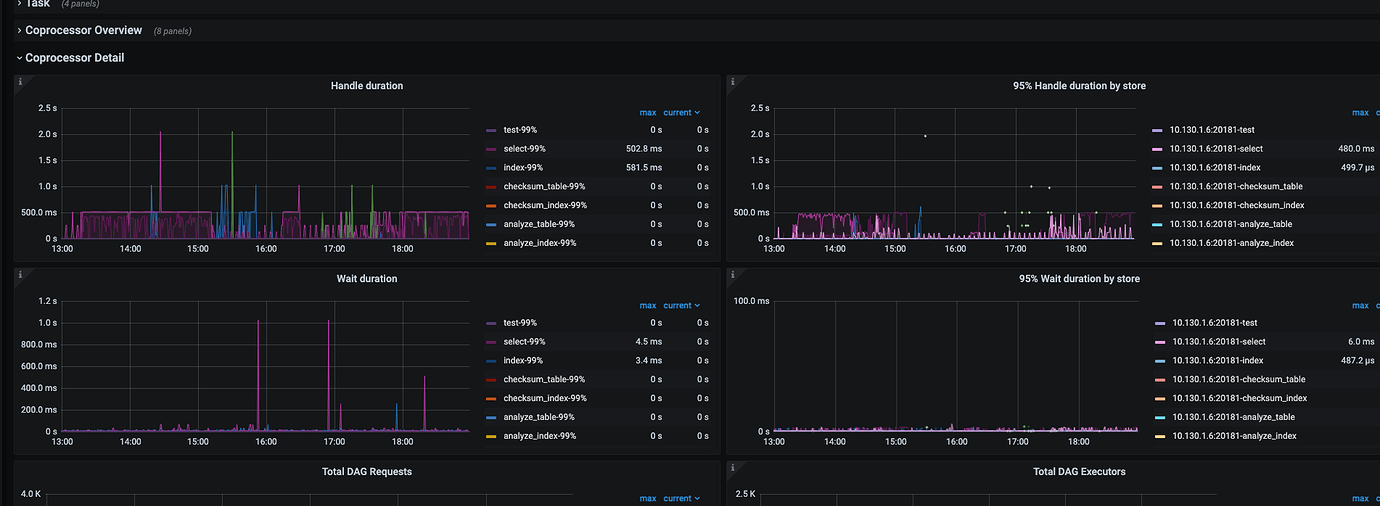
[Overview] Found a SQL Coprocessor execution time is high in the dashboard
[Background] What operations have been done
[Phenomenon] Business and database phenomena
[Problem] Current issues encountered
[Business Impact]
[TiDB Version]
v5.3.0
[Application Software and Version]
Query SQL
SELECT
*,
(UNIX_TIMESTAMP(Time) + 0E0) AS timestamp
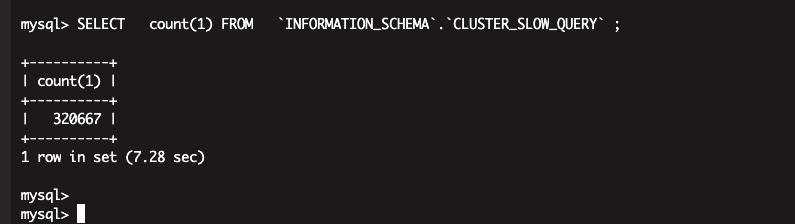
FROM
`INFORMATION_SCHEMA`.`CLUSTER_SLOW_QUERY`
WHERE
Digest = ?
AND Time = FROM_UNIXTIME(?)
AND Conn_id = ?
ORDER BY
`CLUSTER_SLOW_QUERY`.`Digest`
LIMIT
1 [arguments: ("586a74b074be90fdc15a7af20153ceaaf07d877490862b76eb165f6913d0a1e7", 1655444620.521209, "1306415")];
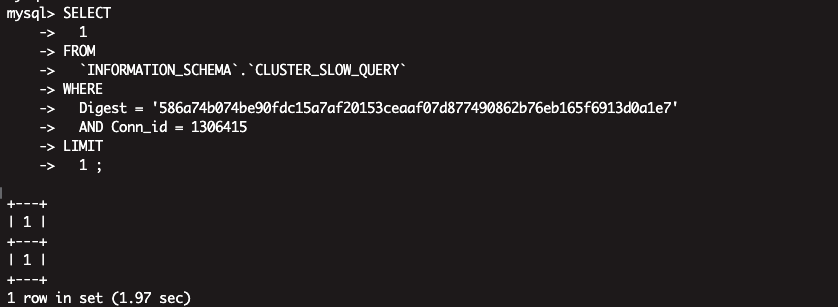
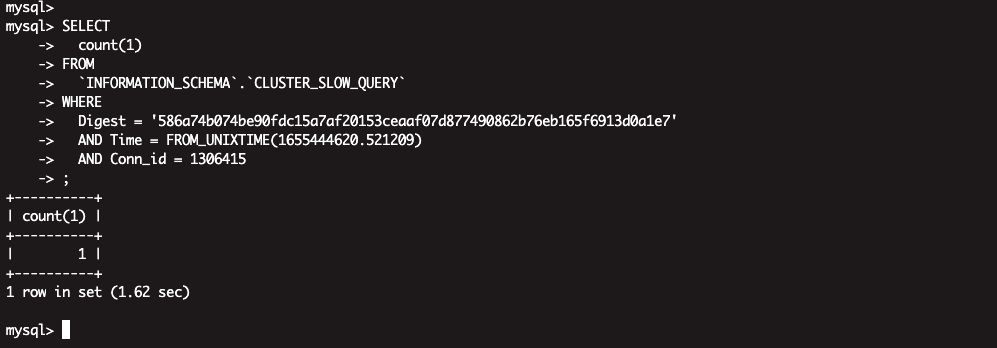
It takes 2 seconds, but if you remove the order by, the query takes 400 milliseconds. Based on the conditions, there is only one piece of data, so the order by shouldn’t be that slow.
If the question is about performance optimization or troubleshooting, please download the script and run it. Please select all and copy-paste the terminal output.