Note:
This topic has been translated from a Chinese forum by GPT and might contain errors.
Original topic: tidb 4.0.8 升级到5.4.2 出现io使用率高
[TiDB Usage Environment] Production Environment
[TiDB Version] 5.4.2
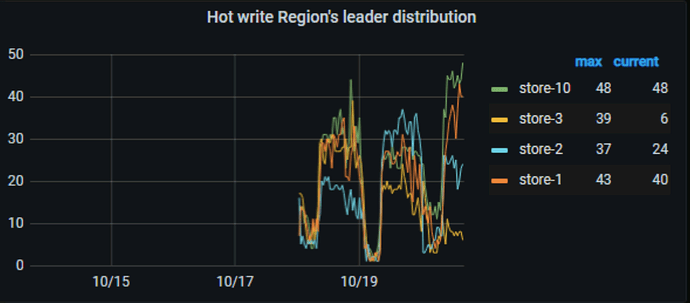
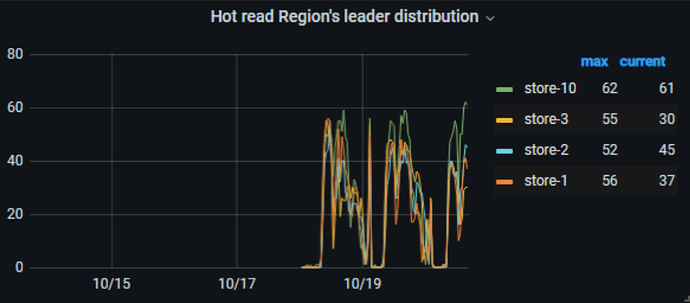
[Encountered Problem] Increased IO in the new version, experiencing hot write and hot read
[Reproduction Path]
[Problem Phenomenon and Impact]
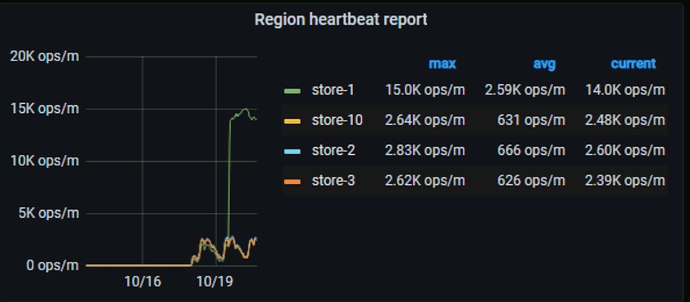
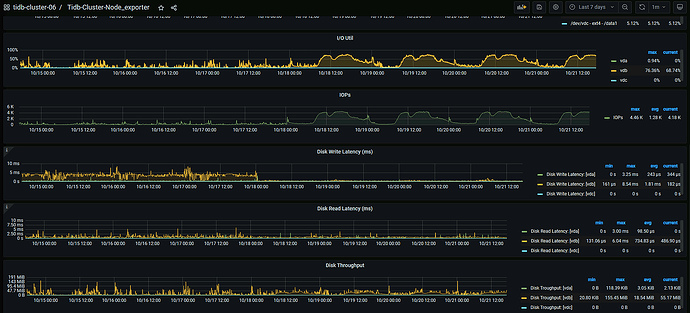
After upgrading TiDB from 4.0.8 to 5.4.2 in the early morning of the 18th, the IO usage rate has increased significantly in the past few days, averaging 70%, nearly double the previous rate. Hot write and hot read issues have also appeared. Currently, only 30% of the traffic has been redirected, fearing that the system won’t handle the full traffic load.
Go check the visual traffic graph, where you can see which specific table is experiencing hotspot writes.
Looking at the visualization view, there is a write hotspot on the index. How can the index be scattered?
I see that the table already has the attribute shard_row_id_bits=4 added.
https://metricstool.pingcap.com/#backup-with-dev-tools
Follow this to export the monitoring data of TiDB and TiKV-detail before and after the upgrade. Make sure to expand all panels and wait for the data to load completely before exporting, otherwise there will be no data.
It seems that the disk read volume after the upgrade is lower than before the upgrade.
- Find a TiKV with high IO and check the disk performance before and after the upgrade.
- Check if there are any changes in the execution plan of slow SQL.
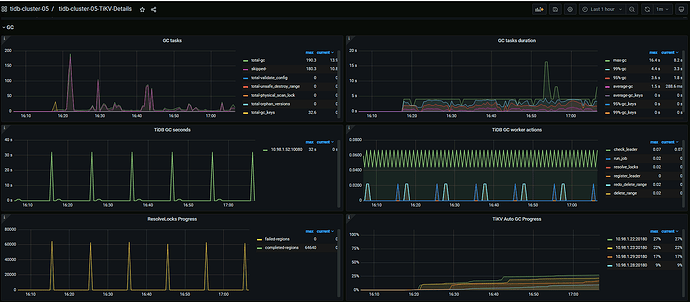
- Is the gc.enable-compaction-filter parameter set to true? If so, try changing it to false and see.
The execution plan of the slow SQL has not changed, and the number of slow SQLs is the same as before, with no sudden increase.
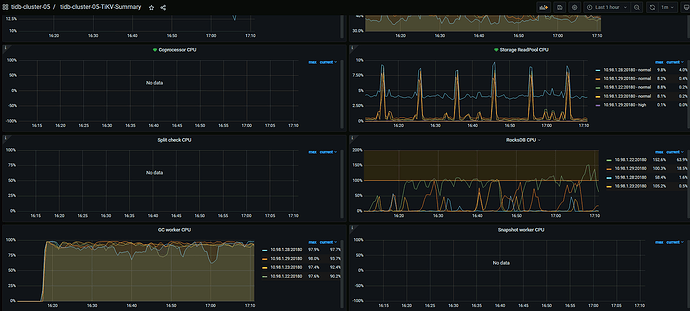
gc.enable-compaction-filter is set to true. After changing it to false, the values of CPU, memory, IO, and MBps all increased.
The production environment cannot be modified, so we can only test the changes in the simulation environment. The version in the simulation environment is also 5.4.2.
The IO utilization hasn’t changed. What type of disk are you using? Check the GC-related monitoring, and after running for a while, check the utilization again.
The disk is SSD, and the IO has increased by about 6~10%.
From the previous TiKV monitoring, the requests hitting TiKV haven’t changed much. There was consistent GC activity before the upgrade, but during this period after the upgrade, the amount is even lower than before the upgrade. However, the disk utilization has remained relatively stable. Can you confirm that there are no other programs running on the disk?
The TiDB machines are used exclusively, with no other programs running. Although IO read/write has decreased, QPS has not dropped. The IO usage rate is relatively high and stable, whereas before the upgrade, there were peaks and troughs.
Post the disk monitoring data and compare the IOPS, throughput, and latency before and after.
The disk IO information of one of the KV nodes upgraded in the early morning of the 18th
IOPS has increased significantly compared to before, and the throughput is also somewhat higher than before. Please export the monitoring data of the TiDB server and check the slow SQL.
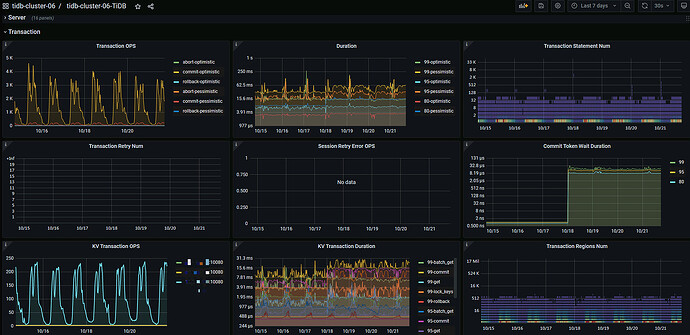
There are no significant changes in OPs.
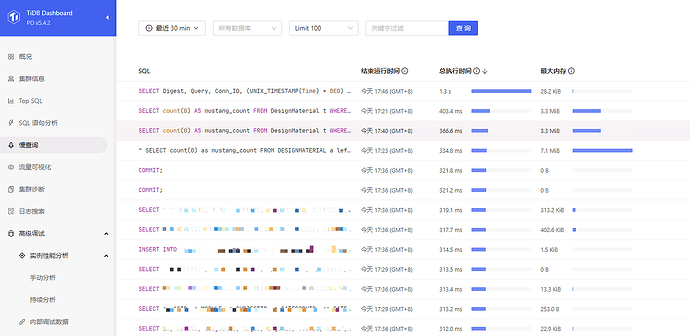
We have real-time monitoring for slow queries, and there are no more than 50 queries exceeding 1 second in a day.
The block cache read volume of RocksDB has increased significantly compared to before, indicating a substantial increase in requests. The index scan has decreased after the upgrade, which seems to be related to changes in the execution plan before and after the upgrade.
