Note:
This topic has been translated from a Chinese forum by GPT and might contain errors.Original topic: tikv节点io占用率高
【TiDB Usage Environment】Production Environment or Test Environment or POC: Production
【TiDB Version】5.3
【Encountered Issue】High IO usage on tikv nodes
【Problem Phenomenon and Impact】
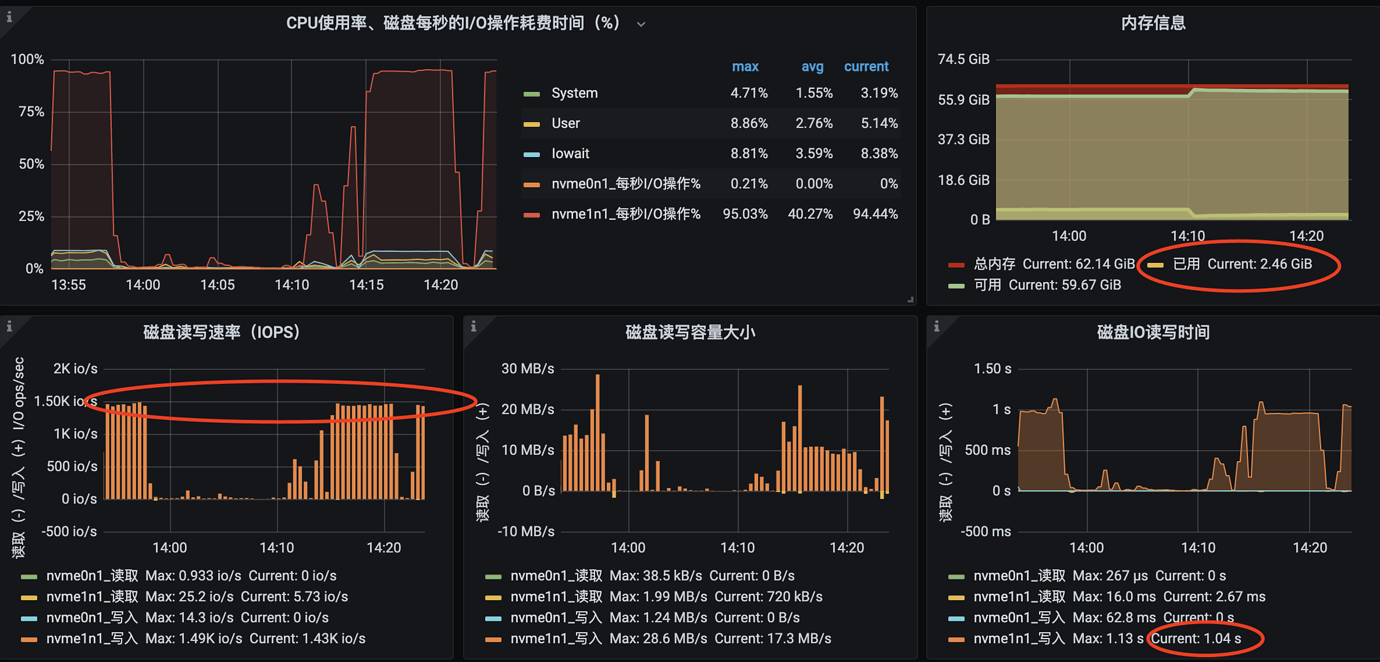
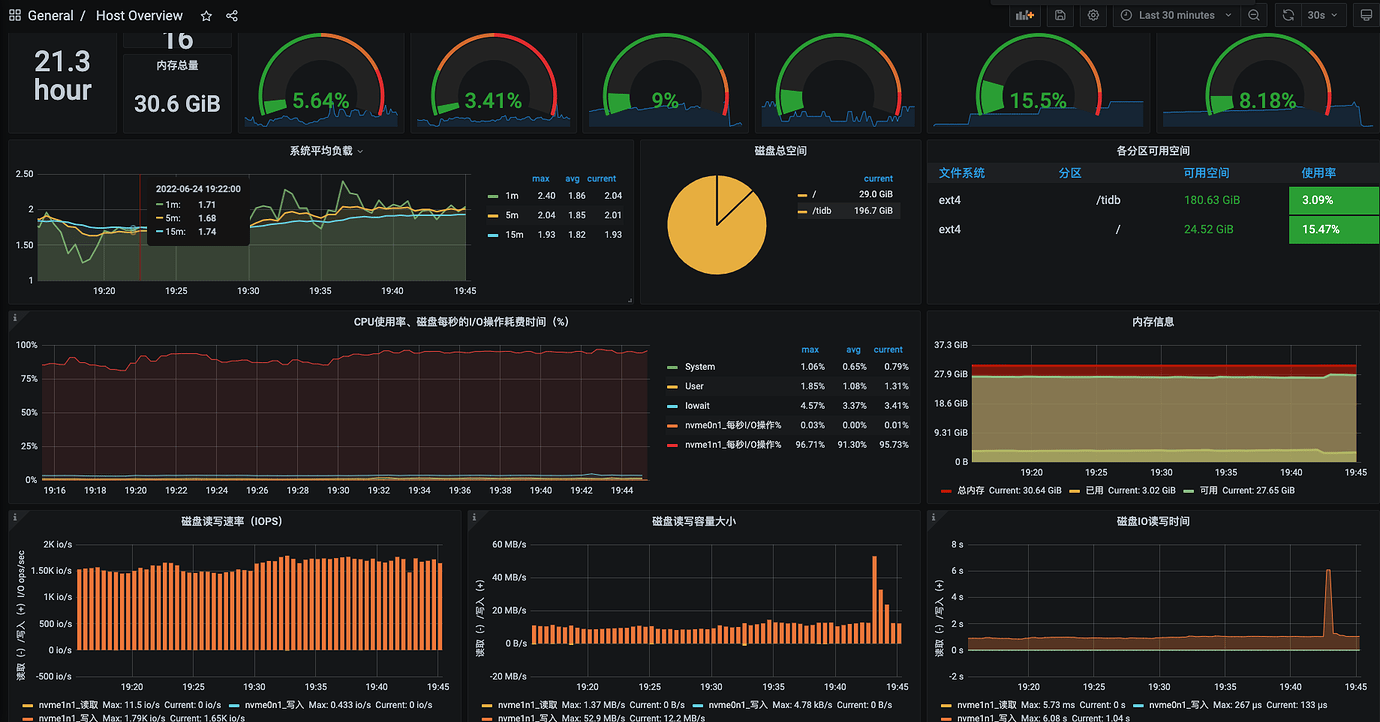
Currently, the production environment TiDB cluster has 5 tikv nodes, some configured with 4 cores and 8GB, and some with 16 cores and 32GB. The data disk is of the AWS gps3 type (SSD) with a baseline IOPS of 3000. Currently, all tikv nodes maintain an IOPS of 1500, with read/write rates around 10MB/s and latency around 1s. The encountered issue is very similar to the one described in this blog http://laddyq.com/article/36733.html. According to the blog, disk mount parameters were increased to commit=60, data=writeback, and tikv configuration parameters were set to sync-log=false, but it still did not work.
tikv version
# tiup tikv:v5.3.0 --version
Starting componenttikv: /root/.tiup/components/tikv/v5.3.0/tikv-server --version
TiKV
Release Version: 5.3.0
Edition: Community
Git Commit Hash: 6c1424706f3d5885faa668233f34c9f178302f36
Git Commit Branch: heads/refs/tags/v5.3.0
UTC Build Time: 2021-11-19 16:24:14
Rust Version: rustc 1.56.0-nightly (2faabf579 2021-07-27)
Enable Features: jemalloc mem-profiling portable sse protobuf-codec test-engines-rocksdb cloud-aws cloud-gcp
Profile: dist_release
TiUP Cluster Display Information
tikv node host monitoring
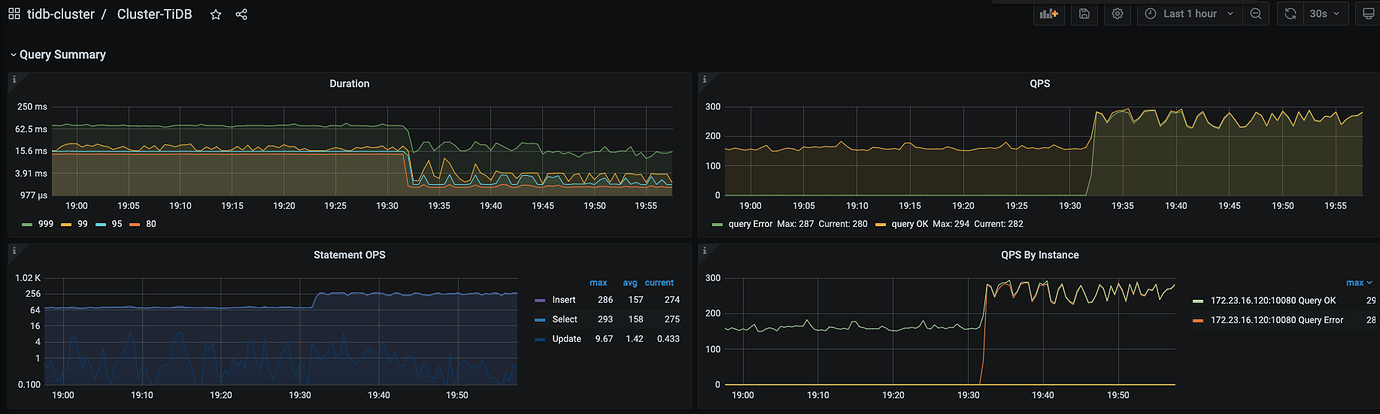
tidb real-time maximum QPS only 300
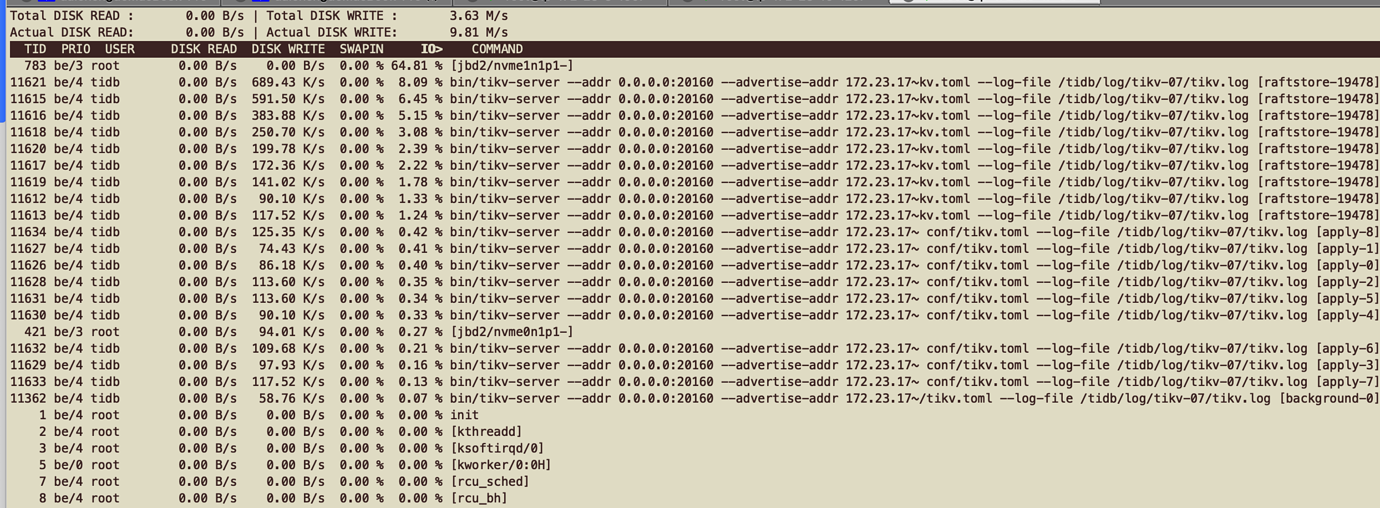
tikv node io situation
TiUP Cluster Edit Config Information
global:
user: tidb
ssh_port: 22
ssh_type: builtin
deploy_dir: /tidb/deploy
data_dir: /tidb/data
os: linux
arch: amd64
monitored:
node_exporter_port: 9100
blackbox_exporter_port: 9115
deploy_dir: /tidb/deploy/monitor-9100
data_dir: /tidb/data/monitor-9100
log_dir: /tidb/deploy/monitor-9100/log
server_configs:
tidb:
log.enable-timestamp: true
log.file.max-backups: 3
log.file.max-days: 3
log.level: info
oom-action: log
tikv:
raftdb.allow-concurrent-memtable-write: true
raftdb.max-background-jobs: 4
raftstore.apply-pool-size: 3
raftstore.store-pool-size: 3
readpool.storage.normal-concurrency: 3
readpool.unified.max-thread-count: 8
readpool.unified.min-thread-count: 3
rocksdb.max-background-jobs: 4
server.grpc-concurrency: 2
storage.scheduler-worker-pool-size: 10
pd:
log.file.max-backups: 3
log.file.max-days: 3
log.level: INFO
metric.interval: 15s
schedule.max-merge-region-keys: 200000
schedule.max-merge-region-size: 20
schedule.patrol-region-interval: 15ms
tiflash: {}
tiflash-learner: {}
pump: {}
drainer: {}
cdc: {}
tidb_servers:
- host: 172.23.16.120
ssh_port: 22
port: 4000
status_port: 10080
deploy_dir: /tidb/deploy/tidb-01
log_dir: /tidb/deploy/tidb-01/log
arch: amd64
os: linux
tikv_servers: - host: 172.23.25.132
ssh_port: 22
port: 20160
status_port: 20180
deploy_dir: /tidb/deploy/tikv-03
data_dir: /tidb/data/tikv-03
log_dir: /tidb/deploy/tikv-03/log
config:
raftdb.allow-concurrent-memtable-write: true
raftdb.max-background-jobs: 12
raftstore.apply-pool-size: 9
raftstore.store-pool-size: 9
readpool.storage.normal-concurrency: 9
readpool.unified.max-thread-count: 16
readpool.unified.min-thread-count: 9
rocksdb.max-background-jobs: 8
server.grpc-concurrency: 8
arch: amd64
os: linux - host: 172.23.8.223
ssh_port: 22
port: 20160
status_port: 20180
deploy_dir: /tidb/deploy/tikv-04
data_dir: /tidb/data/tikv-04
log_dir: /tidb/deploy/tikv-04/log
arch: amd64
os: linux - host: 172.23.12.99
ssh_port: 22
port: 20160
status_port: 20180
deploy_dir: /tidb/deploy/tikv-05
data_dir: /tidb/data/tikv-05
log_dir: /tidb/deploy/tikv-05/log
arch: amd64
os: linux - host: 172.23.17.81
ssh_port: 22
port: 20160
status_port: 20180
deploy_dir: /tidb/deploy/tikv-07
data_dir: /tidb/data/tikv-07
log_dir: /tidb/log/tikv-07/
config:
raftdb.allow-concurrent-memtable-write: true
raftdb.max-background-jobs: 12
raftstore.apply-pool-size: 9
raftstore.store-pool-size: 9
raftstore.sync-log: false
readpool.storage.normal-concurrency: 9
readpool.unified.max-thread-count: 16
readpool.unified.min-thread-count: 8
rocksdb.defaultcf.max-write-buffer-number: 12
rocksdb.defaultcf.write-buffer-size: 1024MB
rocksdb.max-background-jobs: 12
server.grpc-concurrency: 8
storage.block-cache.capacity: 2GB
storage.scheduler-worker-pool-size: 15
arch: amd64
os: linux - host: 172.23.8.190
ssh_port: 22
port: 20160
status_port: 20180
deploy_dir: /tidb/deploy/tikv-08
data_dir: /tidb/data/tikv-08
log_dir: /tidb/log/tikv-08
config:
raftstore.sync-log: false
arch: amd64
os: linux
tiflash_servers: - host: 172.23.18.56
ssh_port: 22
tcp_port: 9000
http_port: 8123
flash_service_port: 3930
flash_proxy_port: 20170
flash_proxy_status_port: 20292
metrics_port: 8234
deploy_dir: /tidb-deploy/tiflash-9000
data_dir: /tidb/data/tiflash-9000
log_dir: /tidb-deploy/tiflash-9000/log
arch: amd64
os: linux
pd_servers: - host: 172.23.16.120
ssh_port: 22
name: pd-03
client_port: 2379
peer_port: 2380
deploy_dir: /tidb/deploy/pd-03
data_dir: /tidb/data/pd-03
log_dir: /tidb/deploy/pd-03/log
arch: amd64
os: linux - host: 172.23.18.56
ssh_port: 22
name: pd-04
client_port: 2379
peer_port: 2380
deploy_dir: /tidb/deploy/pd-04
data_dir: /tidb/data/pd-04
log_dir: /tidb/deploy/pd-04/log
arch: amd64
os: linux
- TiDB- Overview Monitoring
- Corresponding module logs (including logs 1 hour before and after the issue) →