Note:
This topic has been translated from a Chinese forum by GPT and might contain errors.
Original topic: tidb server内存使用多,自动杀掉sql在tidb日志的现象
[TiDB Usage Environment] Production Environment / Testing / PoC
[TiDB Version]
[Reproduction Path] What operations were performed when the issue occurred
[Encountered Issue: Issue Phenomenon and Impact]
[Resource Configuration] Go to TiDB Dashboard - Cluster Info - Hosts and take a screenshot of this page
[Attachments: Screenshots/Logs/Monitoring]
Is the log record in TiDB showing [ERROR] [adapter.go:466] [“execute sql panic”]?
This usually indicates that an uncaught panic (i.e., a runtime error in Go language) occurred while executing an SQL statement. To determine the specific error, it is necessary to analyze the context of the logs.
The TiDB server process is occupying too much memory and has been OOM-killed. The logs only show an “execute sql panic” message. I’m not sure if TiDB automatically killed any large-memory SQL queries before the OOM. If it did, what kind of message would be in the logs?
You need to configure the tidb_mem_quota_query and tidb_mem_oom_action parameters to specify how to handle SQL queries that exceed the memory limit.
Configured it, just want to confirm if it has taken effect.
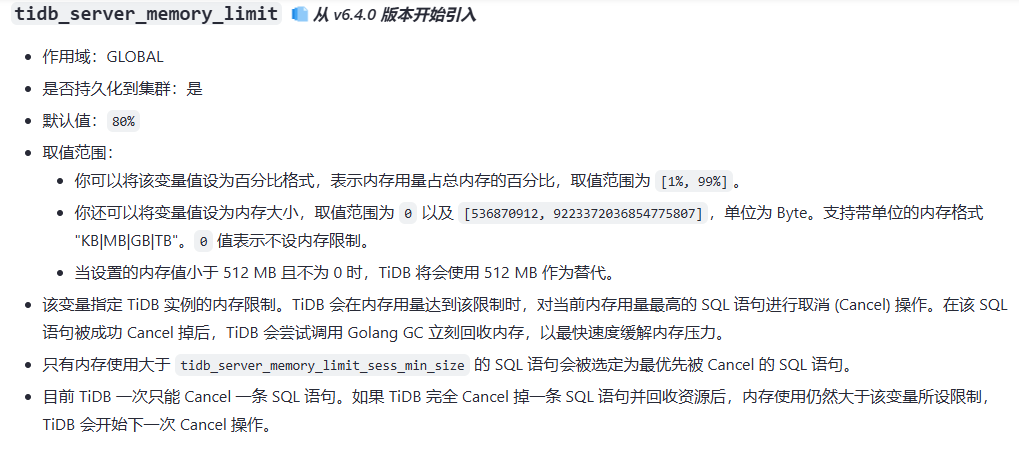
Search for this keyword “servermemorylimit.go” in the logs.
Just directly select * from the large table in full, and you’ll know.
Check the TiDB configuration file and find the following configuration:
path = "/data/tidb"
Enter this directory, and you will find the following files:
running_sql
heap
goroutine
Use these files to troubleshoot the issue.
Matched, TiDB error timestamp [ERROR] [adapter.go:466] [“execute sql panic”], program error: java.sql.BatchUpdateException: Your query has been cancelled due to exceeding the allowed memory limit for the tidb-server instance and this query is currently using the most memory. Please try narrowing your query scope or increase the tidb_server_memory_limit and try again.
This indicates that a statement was indeed cancelled.
