【TiDB Usage Environment】Production, Testing, Research
【TiDB Version】v5.3.0
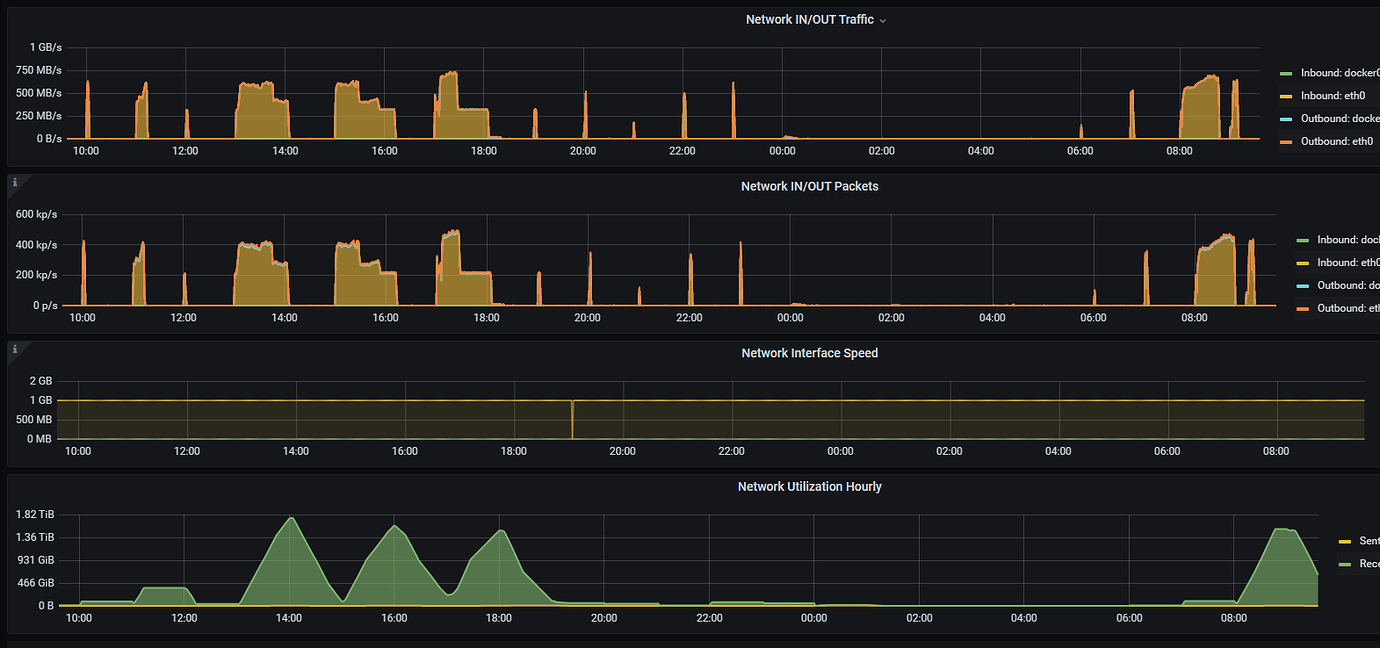
【Encountered Problem】High traffic in a short period on TiDB, needs optimization
【Reproduction Path】What operations were performed that caused the problem
【Problem Phenomenon and Impact】
This looks like it might be caused by a scheduled script, consider whether some restrictions can also be synchronized on the business side.
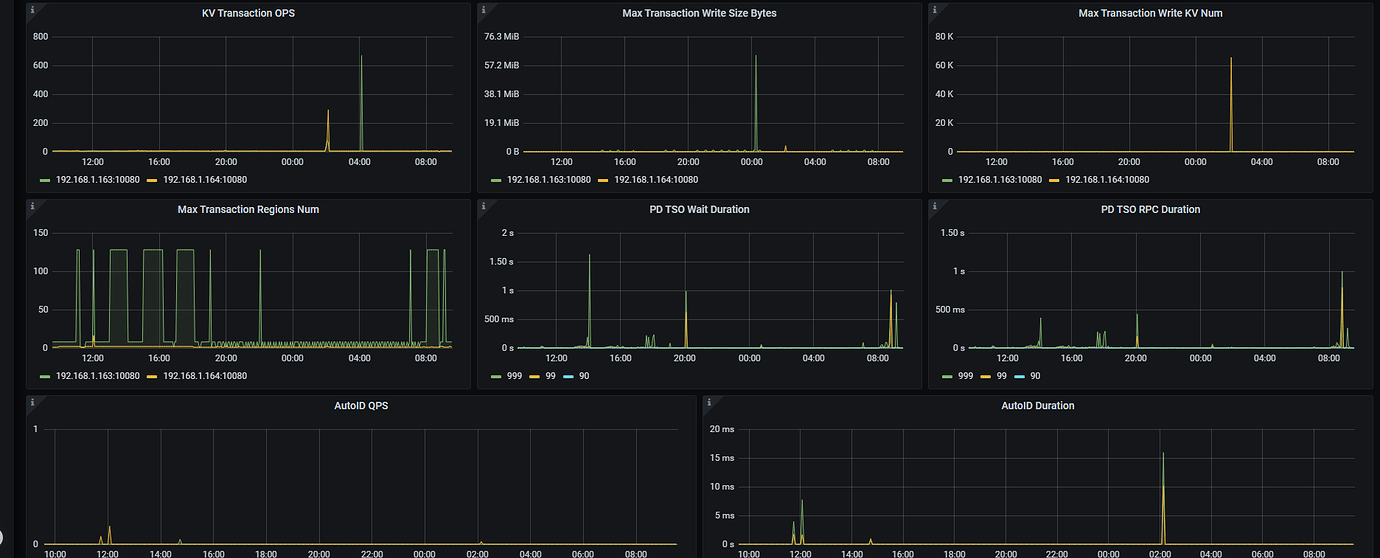
If the traffic is high, you can check the Dashboard to see if it is caused by reading a large amount of data. It may not necessarily be a large number of queries; it could be some queries retrieving a large amount of data at once, which might result in slow queries. You can consider limiting queries that exceed a certain number of seconds.
The data is from the TiKV node to TiDB. However, this data is not directly returned to the business service, as the traffic between the business service and TiDB is not particularly high.
Without a direct view, you can check the total number of connections (active + inactive) through the Connection Count in tidb->Server. You can also estimate the number of concurrent active sessions using QPS*Duration/1000ms.
That sounds like it might be caused by slow queries. Some data might have missed the index, causing TiDB to fetch a lot of data from TiKV and then aggregate it at the Server layer. You can check the slow queries and SQL resource consumption in TiDB Dashboard during that period.
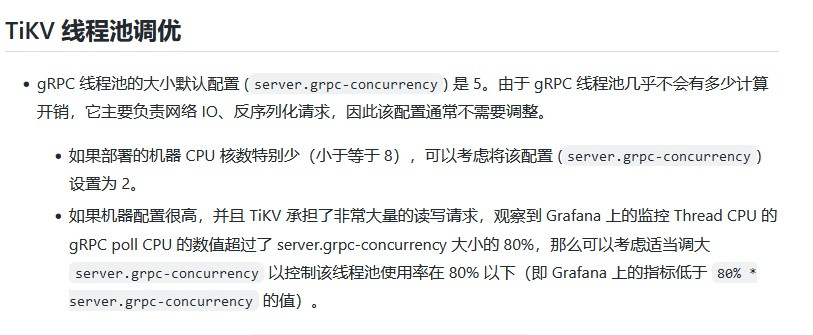
On the TiDB instance side, you can control concurrency through token-limit.
Optimize SQL to push operators down to the store as much as possible to reduce network traffic.
Increase the number of TiDB instances and set up load balancing.
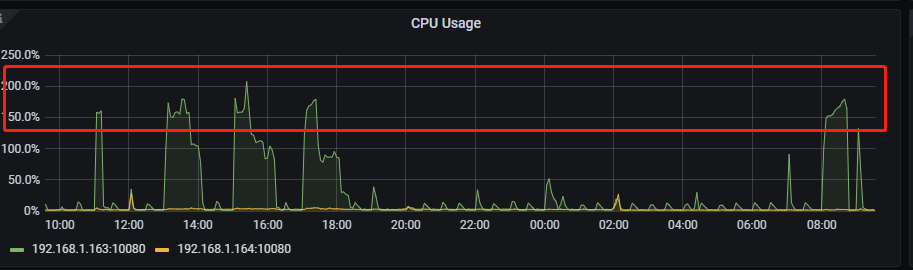
Actually, the main reason is the presence of SQL with very high total CPU usage. Just identify and reduce the high CPU usage SQL on the dashboard to resolve the issue.