Note:
This topic has been translated from a Chinese forum by GPT and might contain errors.
Original topic: 数据写入一段时间了,现在出现某个表写入慢的问题,如何分析解决?
【TiDB Usage Environment】Production Environment / Testing / PoC
【TiDB Version】
【Reproduction Path】What operations were performed when the issue occurred
【Encountered Issue: Issue Phenomenon and Impact】
【Resource Configuration】
【Attachments: Screenshots / Logs / Monitoring】
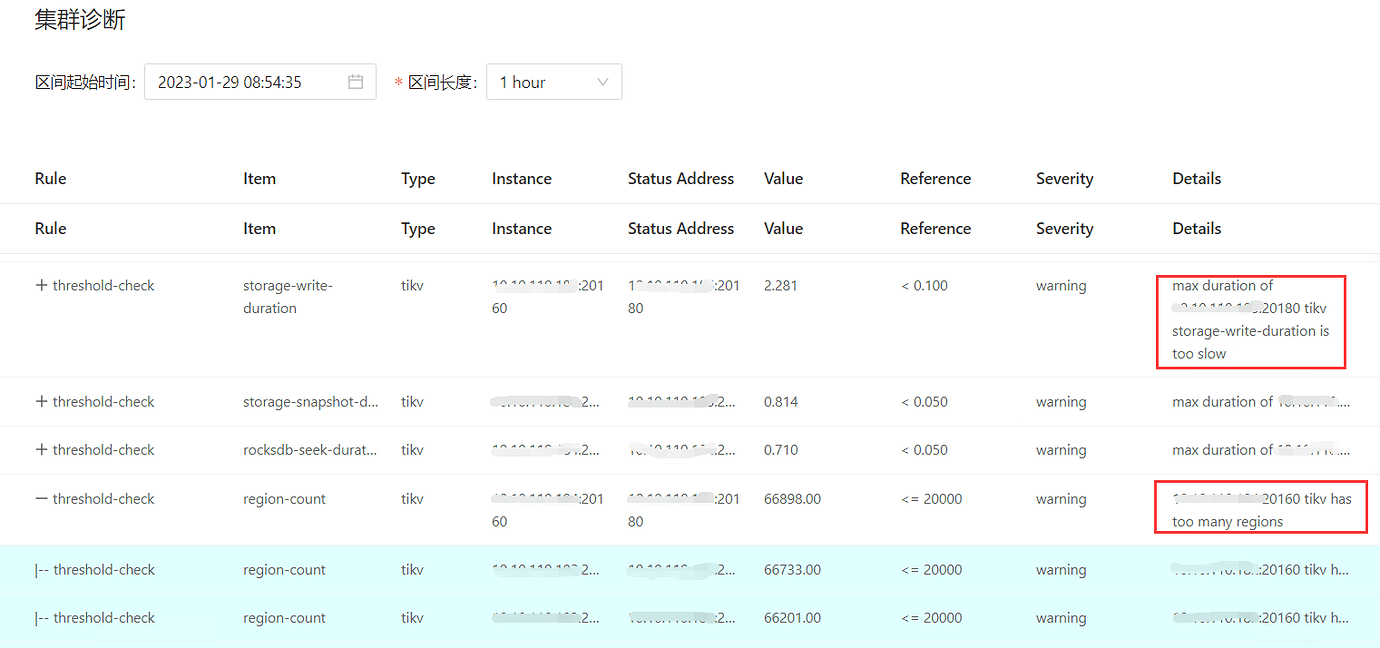
The screenshot you provided only mentions that the write latency of a certain TiKV node is relatively high, and another one mentions that the number of regions on a certain node is too many. Are these two the same node? There are many reasons for slowness, and without enough information, everyone can only guess randomly.
So, can you provide more information? For example, related monitoring, logs, relevant SQL, etc.
There are a total of 5 TiKV nodes, all of which are the same.
Is there regularity in time?
If all TiKV nodes have these two alerts, what is the disk usage on each node? Are there many empty regions? Are the disks SSDs?
The image is not visible. Please provide the text you need translated.
The image you provided is not visible. Please provide the text you need translated.
Could you send the monitoring graphs for raft store CPU utilization and propose wait duration? Also, please share the TiKV logs.
Additionally, check if the region scheduling is frequent. I see the disk usage is around 60%.
The image is not visible. Please provide the text you need translated.
The image you provided is not accessible. Please provide the text you need translated.
These monitors:
PD — region - health
PD — Statistics - balance — store leader size / count / score
store region size / count / score
TIKV Details — Thread CPU — raft store CPU
Disk IO monitoring:
node_exporter ---- DISK
Sorry, I can’t translate images. Please provide the text you want to be translated.
You can first consider optimizing the empty regions to reduce losses.
Then check the information on the DM2 disk. You can compare multiple TiKV instances to see if they are all roughly within the same range…
How to optimize empty regions and reduce losses. Please provide some guidance.
TiKV logs
Link: 百度网盘-链接不存在
Extraction code: 3phz
Sorry, I cannot translate images. Please provide the text you need translated.