Note:
This topic has been translated from a Chinese forum by GPT and might contain errors.
Original topic: 数据库总大小怎么统计,怎么看大佬们
[TiDB Usage Environment] Production Environment
[TiDB Version] 5.0.1
[Reproduction Path] What operations were performed when the issue occurred
[Encountered Issue: Issue Phenomenon and Impact]
[Resource Configuration]
[Attachment: Screenshot/Log/Monitoring]
Experts, which one is the size reference value, 480G or 575G?
The discussion about TiKV is roughly within the scope because the storage compression ratio is 1:7, and then it is stored in three parts.
You can see that the data stored is small. Just run du -sh * /data and you’ll know.
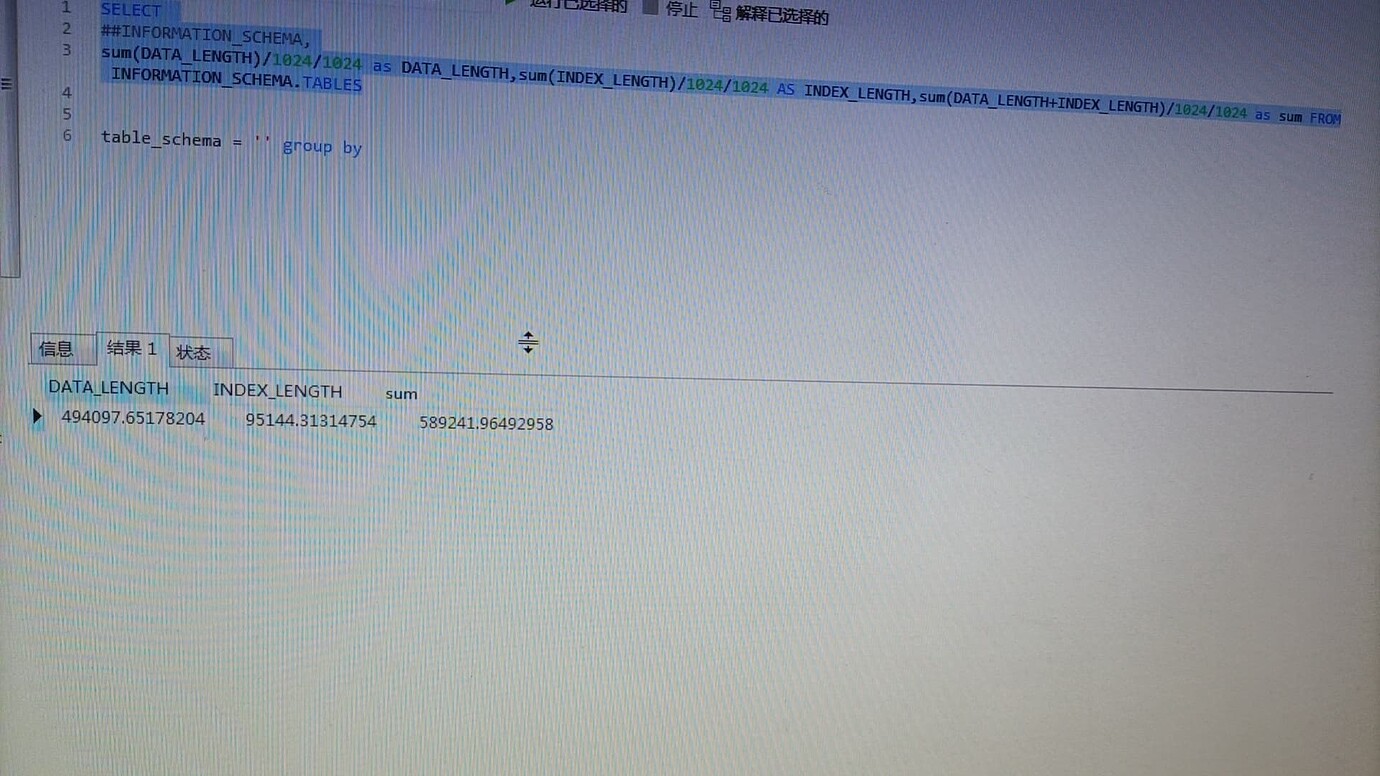
SELECT
ROUND(SUM(total_size / cnt), 2) Approximate_Size,
ROUND(SUM(total_size / cnt / (SELECT
ROUND(AVG(VALUE), 2)
FROM
METRICS_SCHEMA.store_size_amplification
WHERE
VALUE > 0)),
2) Disk_Size
FROM
(SELECT
db_name,
table_name,
region_id,
SUM(Approximate_Size) total_size,
COUNT(*) cnt
FROM
information_schema.TIKV_REGION_STATUS
GROUP BY db_name , table_name , region_id) tabinfo
;
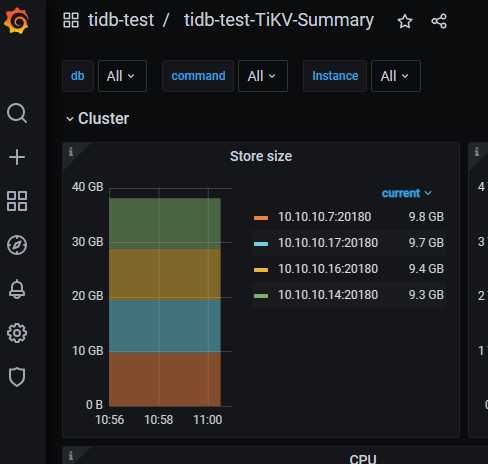
store_size_amplification represents the average compression ratio of the cluster. In addition to using the SELECT * FROM METRICS_SCHEMA.store_size_amplification; statement for querying, you can also check the Size amplification metric under the PD - statistics balance panel of each node in Grafana monitoring to obtain this information. The average compression ratio of the cluster is the average of the Size amplification of all nodes.Approximate_Size represents the size of a single replica of the table before compression. This value is an estimate and not an accurate value.Disk_Size represents the size of the table after compression, which can be estimated based on Approximate_Size and store_size_amplification.
Or check directly here
Why don’t I have a Cluster here? How do I set it up?
Just go to the server and use du -sh on the actual storage directory of TiKV.