Note:
This topic has been translated from a Chinese forum by GPT and might contain errors.
Original topic: 如何查看TiDB集群数据的真实大小
[TiDB Usage Environment] Production Environment
[TiDB Version] 5.0.6
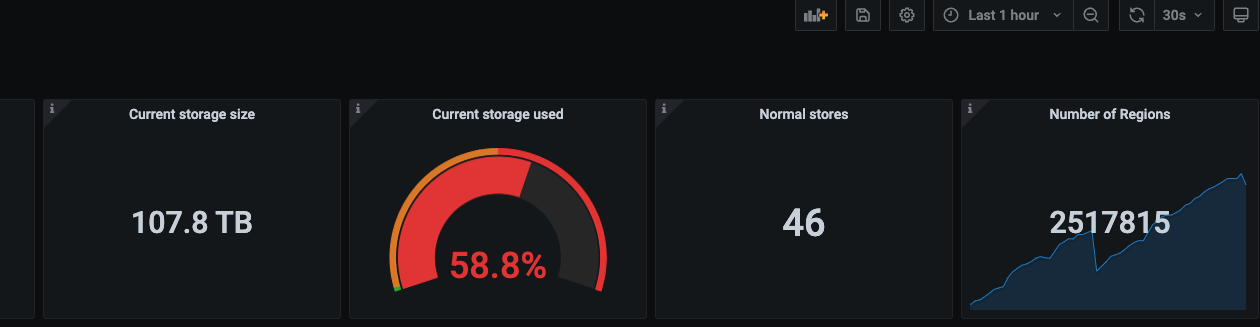
[Reproduction Path] There is a significant discrepancy between PD monitoring and the data dictionary, and there are database names showing as null.
[Encountered Issues: Issue Phenomenon and Impact]
[Resource Configuration]
[Attachments: Screenshots/Logs/Monitoring]
-
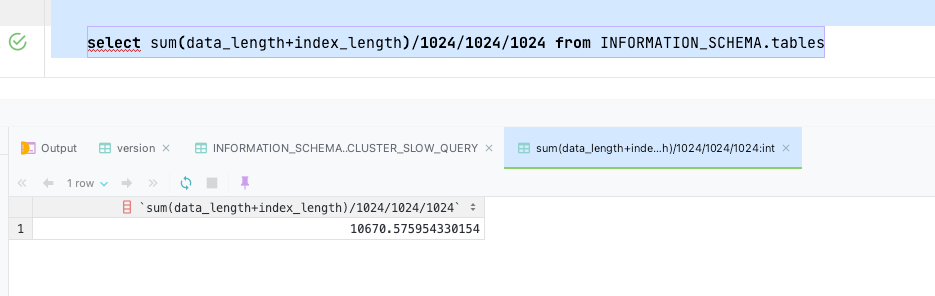
Query tables, less than 10T
select sum(data_length+index_length)/1024/1024/1024 from INFORMATION_SCHEMA.tables;
-
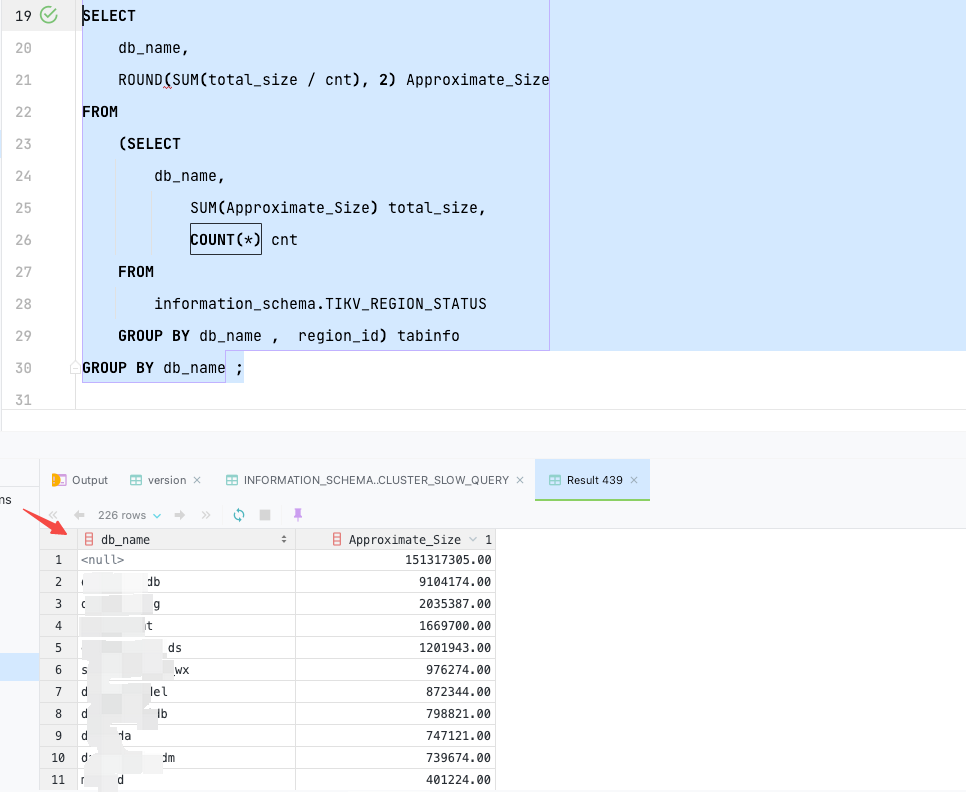
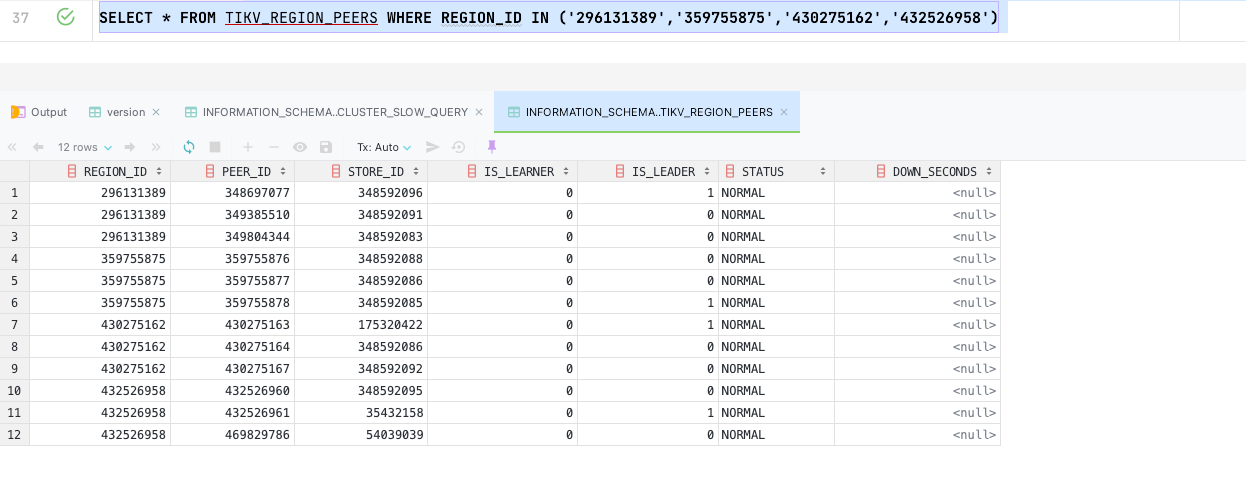
Query TIKV_REGION_STATUS, excluding NULL, adds up to less than 30T
There are two issues:
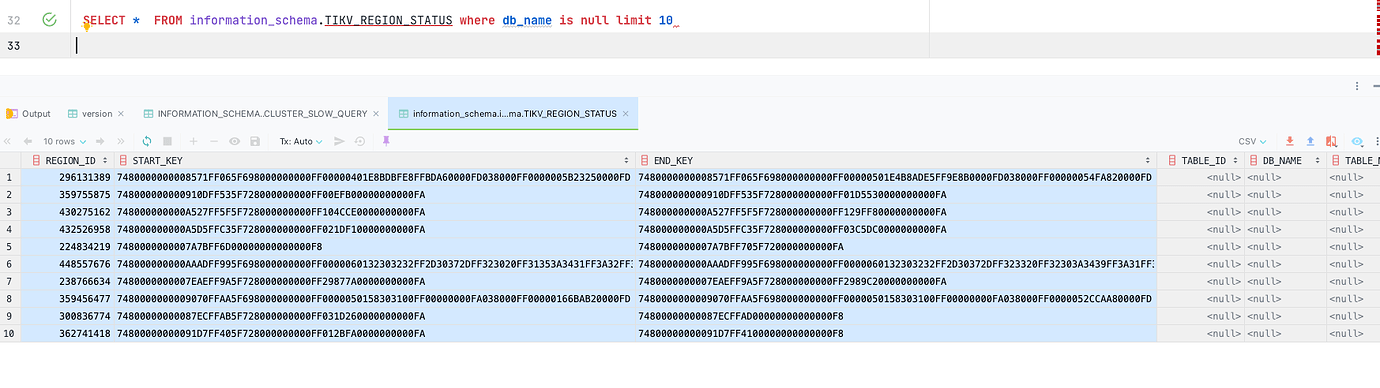
- What causes the db_name to be null?
- What causes the significant discrepancy between PD’s over 100T and the data dictionary, and how can it be resolved?
You can refer to similar posts
This is the post I made, but the administrator might have thought it took too long and set the best answer for me. It doesn’t feel right. The difference is too big, 30T and over 100T.
Check if there are any empty regions.
Yes, check the empty regions. I have a cluster where there is still actual space, but Grafana shows insufficient space. This is because there are too many empty regions, causing a significant difference between the values shown in Grafana and those seen in CentOS.
The issue of empty regions has been posted before, 空region不合并 - TiDB 的问答社区
The issue of empty regions has been posted before, 空region不合并 - TiDB 的问答社区
Grafana’s statistics also include the data volume of TiFlash.
Adding TiFlash still makes a big difference, now it’s over 100TB.
Go to the data disk and run du -sh -d 1. This will give you the most accurate physical storage usage statistics.
What I encountered before was that the physical storage was, for example, 30G, but in Grafana, it showed 300G. As a result, the 1T hard disk was judged to have used 900G with three replicas, indicating insufficient node space, and all leader replicas were moved away. However, the actual physical storage was just 30G.
In the end, I rebuilt the cluster through backup and restore, and Grafana displayed normally.
The physical usage is over 100TB, but the business thinks it’s unreasonable and shouldn’t be this large. We want to check the databases and tables with high usage, and the difference is significant. Moreover, after deleting large tables, the space hasn’t been released even after waiting for a day.
This cluster is too large, backup and recovery are not very feasible.
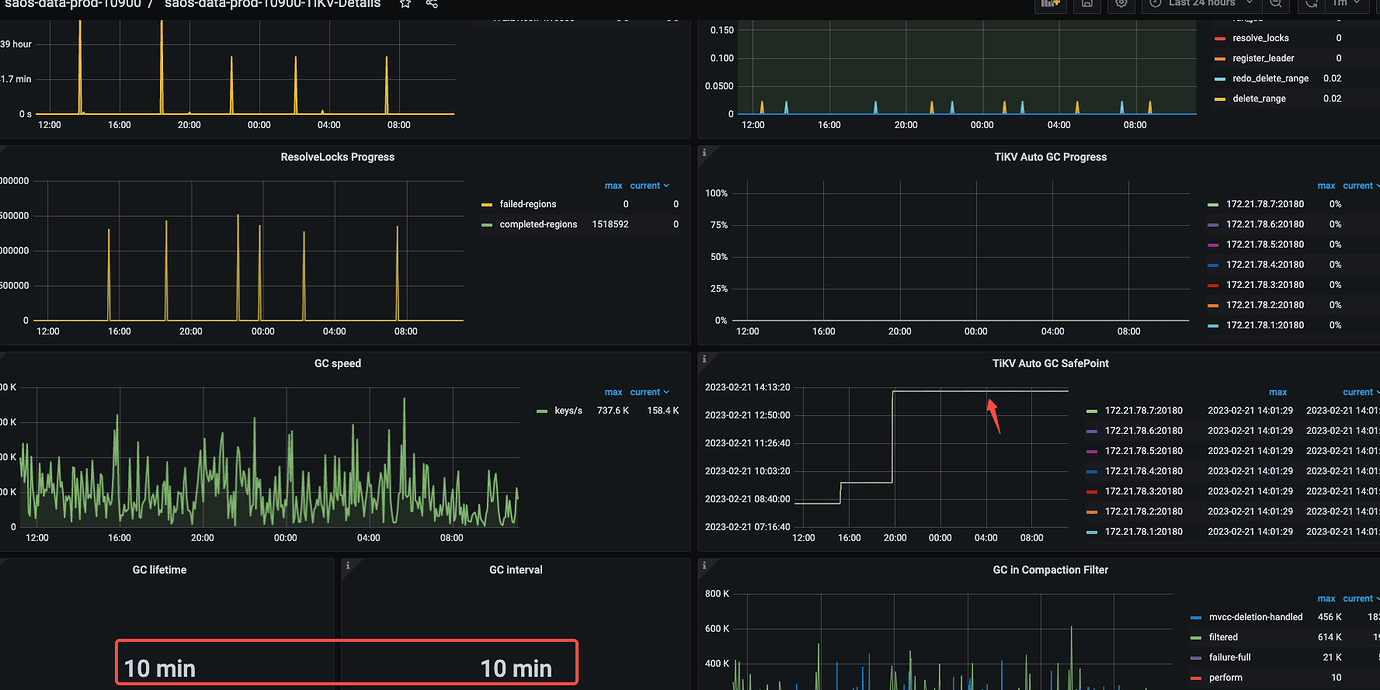
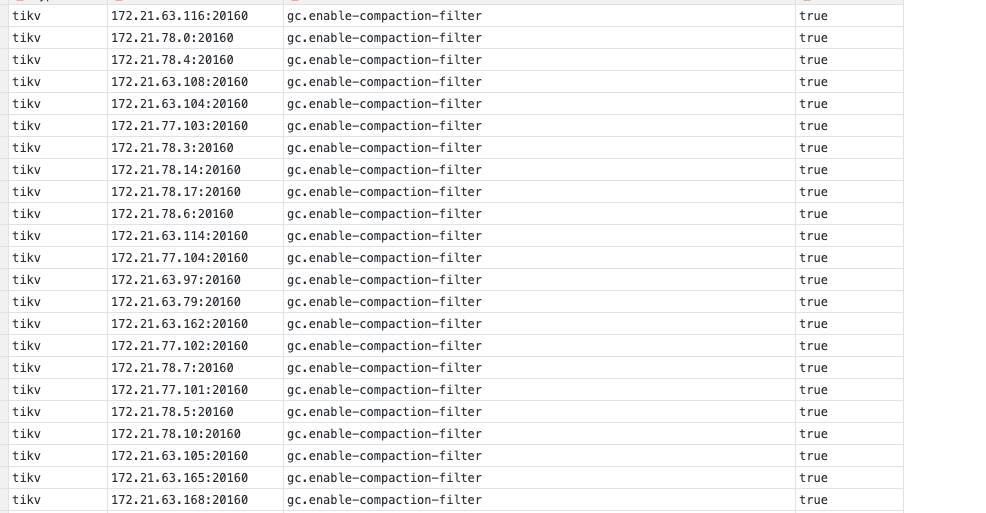
If it feels unreasonable, check if the GC is stuck. For example, if compact is turned off or if the GC adjustments are unreasonable, it could lead to increased space.
This has been encountered in the community before.
The GC parameter is set to 10 minutes, and compact is not disabled. It seems to have gotten stuck yesterday afternoon when some large table drop operations were performed.
Yes, let’s wait for this GC to complete for now. However, the issue of the large gap in volume has always existed. I’m not sure if it’s due to the slow GC collection causing long-term backlog. If the collection speed is too slow each time, it feels like there will always be unfinished collections. Is there any way to improve GC?
You can try the new version, I remember there are optimizations like compact filter.
Our business has a large number of DDL operations. The official documentation states that DDL operations cannot be executed during an upgrade, which is difficult to avoid. Is there any other solution besides upgrading?
Is it possible to manually reclaim empty regions that do not merge? PD Control 使用说明 | PingCAP 文档中心 Nearby region merge, cross-table empty region merge.