Note:
This topic has been translated from a Chinese forum by GPT and might contain errors.
Original topic: tidb某个正在运行的session/process占用的tidb内存多少怎么看
[TiDB Usage Environment] Production Environment / Testing / PoC
[TiDB Version] 7.1
[Encountered Problem: Problem Phenomenon and Impact]
How to check the memory usage of a specific running session/process in TiDB?
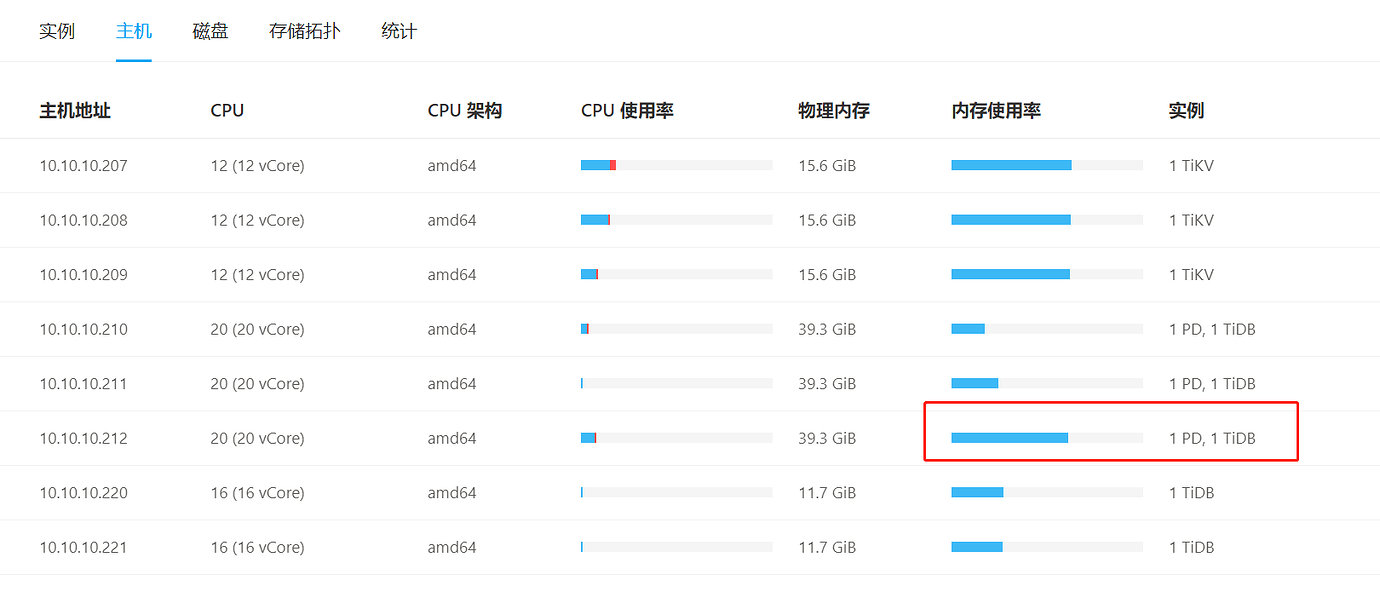
This session is performing data synchronization operations, so it executes a large number of insert operations. The dashboard shows that one TiDB node has high memory usage.
You can check the memory usage of connections at TiDB 连接数占用内存计算(操作系统,summary) - AI牛丝
There seems to be an issue with your link.
I remember that the INFORMATION_SCHEMA.CLUSTER_PROCESSLIST system table has it.
That is very small, it seems to be just the size of an SQL statement.
Yes, it only shows the memory occupied by a single session and the memory used by the request being processed.
It should be what the expert mentioned, INFORMATION_SCHEMA.CLUSTER_PROCESSLIST.
Isn’t it this one? * Execute SELECT * FROM information_schema.processlist; to check the value of the MEM column corresponding to the SQL.
If it is a slow query, you can locate it through TiDB Dashboard → Slow Queries: based on information such as SQL, TiDB instance, end run time, total execution time, etc., and check the memory usage.
Is the mem field accurate in the current version?