Note:
This topic has been translated from a Chinese forum by GPT and might contain errors.Original topic: tidb如何查看系统高峰时的并发数
How to check the number of concurrent connections during peak times in TiDB
Note:
This topic has been translated from a Chinese forum by GPT and might contain errors.Original topic: tidb如何查看系统高峰时的并发数
How to check the number of concurrent connections during peak times in TiDB
Concurrency = QPS * Average Response Time
You can directly find the corresponding data on the TiDB dashboard and calculate it. For the average response time, I personally feel that Database Time can be used.
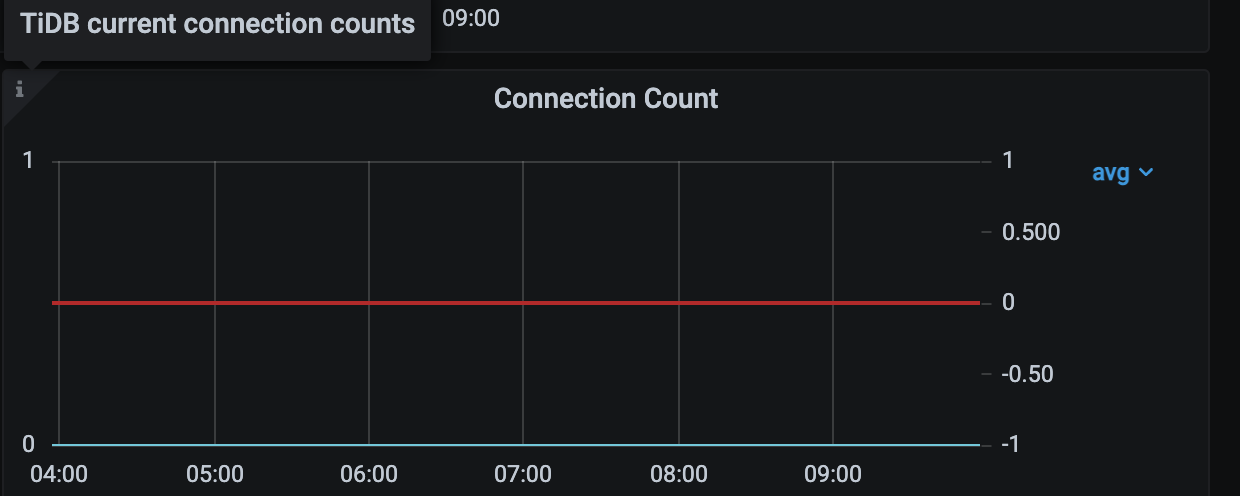
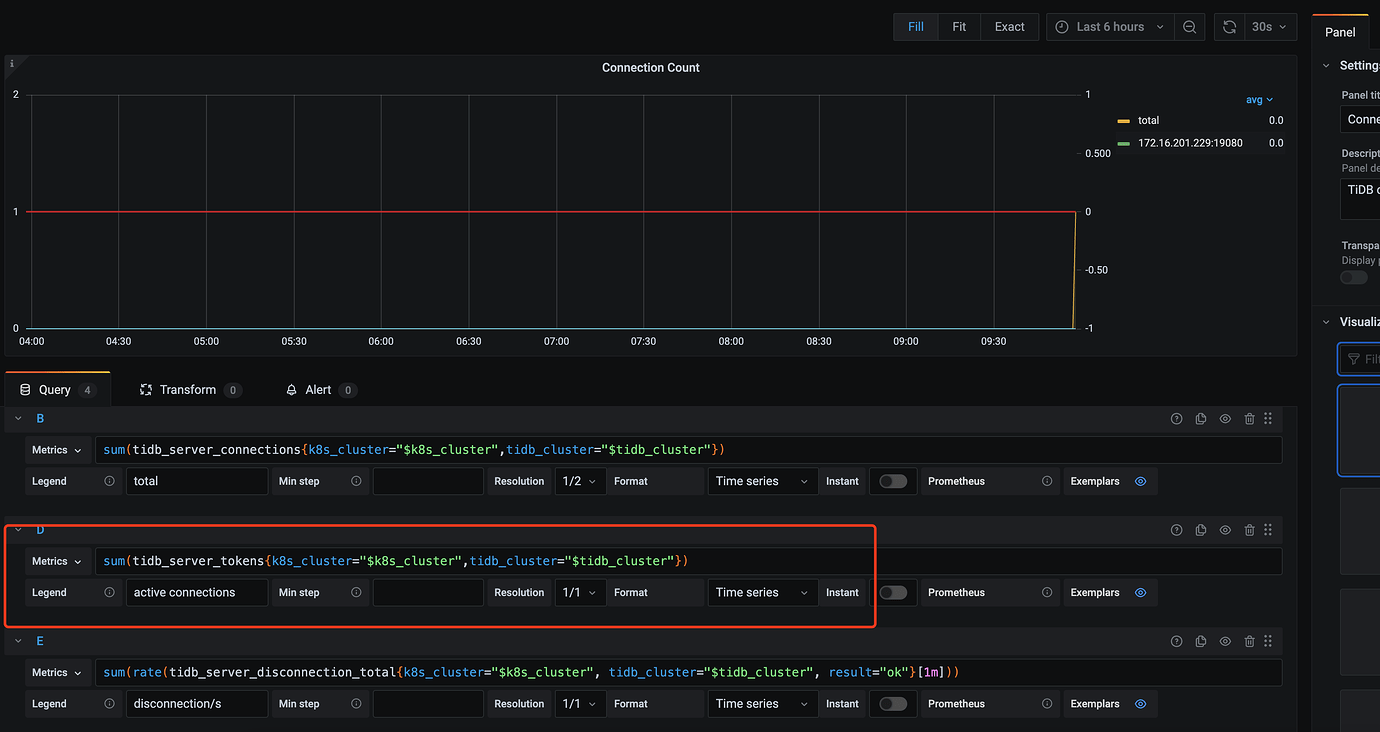
The most direct way is to query the expression tidb_server_tokens in Prometheus, as only this expression represents concurrent connections.
tidb_server_tokens The number of concurrent executing sessions
TYPE tidb_server_tokens gauge
tidb_server_tokens 0
Another way is to check the performance-overview panel, which will display Active connections.
You can directly view QPS on the dashboard. As for how many connections are running SQL, you can check this:
select * from INFORMATION_SCHEMA.CLUSTER_PROCESSLIST t
where t.command<>'Sleep';
Does the concurrency here refer to the number of connections to the DB or something else?
Yes, it’s pretty much as you said. I checked the peak QPS from Grafana, and the average response time is over 1 second, which basically equals the QPS.
No, peak concurrency generally refers to qps * average response time.
This topic was automatically closed 60 days after the last reply. New replies are no longer allowed.