How to Check Which SQL Statements Triggered RocksDB Write Flow Control

Note:
This topic has been translated from a Chinese forum by GPT and might contain errors.

Original topic: 如何查看哪些SQL触发了rocksdb写入流控

| username: alfred

【TiDB Usage Environment】Production\Testing Environment\POC
【TiDB Version】
【Encountered Issues】
【Reproduction Path】What operations were performed to encounter the issue
【Issue Phenomenon and Impact】
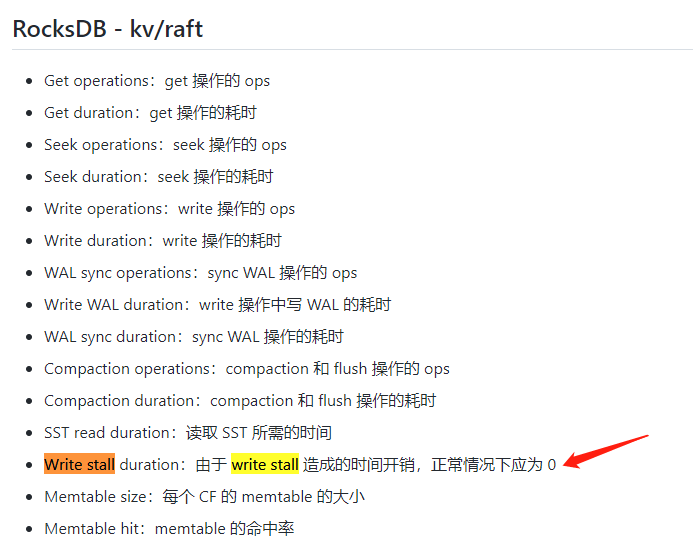
【Attachments】

  • Relevant logs, configuration files, Grafana monitoring (https://metricstool.pingcap.com/)
  • TiUP Cluster Display information
  • TiUP Cluster Edit config information
  • TiDB-Overview monitoring
  • Corresponding module’s Grafana monitoring (if any, such as BR, TiDB-binlog, TiCDC, etc.)
  • Corresponding module logs (including logs from 1 hour before and after the issue)

If the question is related to performance optimization or troubleshooting, please download and run the script. Please select all and copy-paste the terminal output results for upload.

| username: xfworld | Original post link

SQL generally does not trigger writestall. Typically, extremely large requests or concurrent requests may lead to insufficient IO processing capability, causing flow control.

You can see if flow control has been triggered through this parameter:

Official documentation:

| username: alfred | Original post link

I understand that heavy IO usage is generally caused by SQL, but it seems that the Write stall duration monitoring metric cannot be directly traced to SQL?

| username: xfworld | Original post link

The SQL layer only exists on the TiDB nodes and doesn’t have much to do with other nodes.

If you want to monitor whether TiKV is experiencing write pressure, leading to flow control, you can look at this parameter.

| username: alfred | Original post link

From version 6.0 onwards, it supports querying the TiKV Top slow SQL on a specific node.

| username: system | Original post link

This topic was automatically closed 60 days after the last reply. No new replies are allowed.