Note:
This topic has been translated from a Chinese forum by GPT and might contain errors.
Original topic: tidb 监控主机prometheus-8249 目录下的数据目录里面有一个docdb占用空间很大,如何清理
【TiDB Usage Environment】Production Environment
【TiDB Version】tidb v6.1.0
【Encountered Problem】Monitoring disk usage is quite large and not releasing.
The docdb directory under prometheus-8249/data occupies 356G of space. How to clean it?
du -sh *
5.4G 01GF3S30F4GWWBT1R4P4ZESEZ3
1.9G 01GF4DMK79JTYFTDMG33F42FS6
682M 01GF7G5KMM3GDXB1B7WG9V4464
1.9G 01GF7G81CTWDG0JETNWX9KYM03
2.8M chunks_head
356G docdb
0 lock
20K queries.active
164K tsdb
1.2G wal
【Reproduction Path】What operations were performed to cause the problem
【Problem Phenomenon and Impact】
【Attachments】
Please provide the version information of each component, such as cdc/tikv, which can be obtained by executing cdc version/tikv-server --version.
Directly scale down the monitoring, then scale it up again.
Just delete and recreate it.
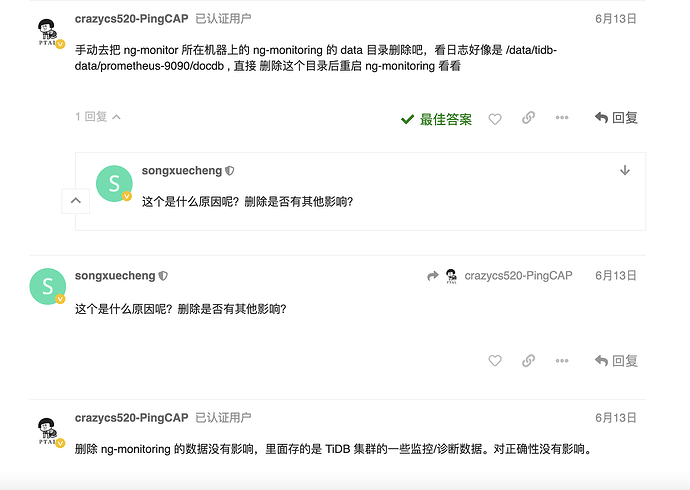
This directory seems to be NgMonitoring. NgMonitoring is an advanced monitoring component built into TiDB v5.4.0 and above clusters, used to support TiDB Dashboard’s continuous performance analysis and Top SQL features. When deploying or upgrading a cluster with a newer version of TiUP, NgMonitoring will be automatically deployed.
Typically, reduce the monitoring nodes first, then expand the monitoring nodes.
1. Advantages and Disadvantages
- Advantages: More thorough cleanup
- Disadvantages: Loss of historical monitoring data
2. Steps
Taking the reduction and expansion of monitoring nodes alertmanager, grafana, and prometheus for the kruidb cluster as an example:
2.1 Reduction
- Syntax format:
tiup cluster scale-in kruidb-cluster -N <monitoring node IP:port>
- Reduction command:
~]$ tiup cluster scale-in kruidb -N 192.168.3.220:9093 -N 192.168.3.220:3000 -N 192.168.3.220:9090
2.2 Expansion
- Write the expansion configuration file monitor.yaml
monitored:
  node_exporter_port: 9100
  blackbox_exporter_port: 9115
monitoring_servers:
  - host: 192.168.3.220
grafana_servers:
  - host: 192.168.3.220
alertmanager_servers:
  - host: 192.168.3.220
- Execute the expansion
## 1. Check
tiup cluster check kruidb monitor.yaml --cluster
## 2. Fix
tiup cluster check kruidb monitor.yaml --cluster --apply --user root -p
## 3. Execute the expansion
tiup cluster scale-out kruidb monitor.yaml
3. Notes
The above operations have been verified in TiDB v6.1.0. I hope it can help with the issues you encounter.
tiup 1.10.2 added timezone checks, and when executing the check, it may report timezone Fail no pd found, auto fixing not supported, which is a known issue and does not affect the expansion. This issue does not exist in tiup 1.9.
Directly scale down and then scale up.
NgMonitoring is an advanced monitoring component built into TiDB v5.4.0 and above clusters, used to support TiDB Dashboard’s continuous performance analysis and Top SQL features.
You can just disable these features.
Two days ago, I deleted docdb and then restarted the Prometheus service. Today, I checked docdb and it is 284G. The key point is that the top SQL feature is not enabled.
You should also turn off the continuous performance analysis on the dashboard interface.
