[TiDB Usage Environment] Production Environment / Testing / PoC
[TiDB Version]
[Reproduction Path] What operations were performed when the issue occurred
[Encountered Issue: Issue Phenomenon and Impact]
[Resource Configuration] Enter TiDB Dashboard - Cluster Info - Hosts and take a screenshot of this page
[Attachments: Screenshots/Logs/Monitoring]
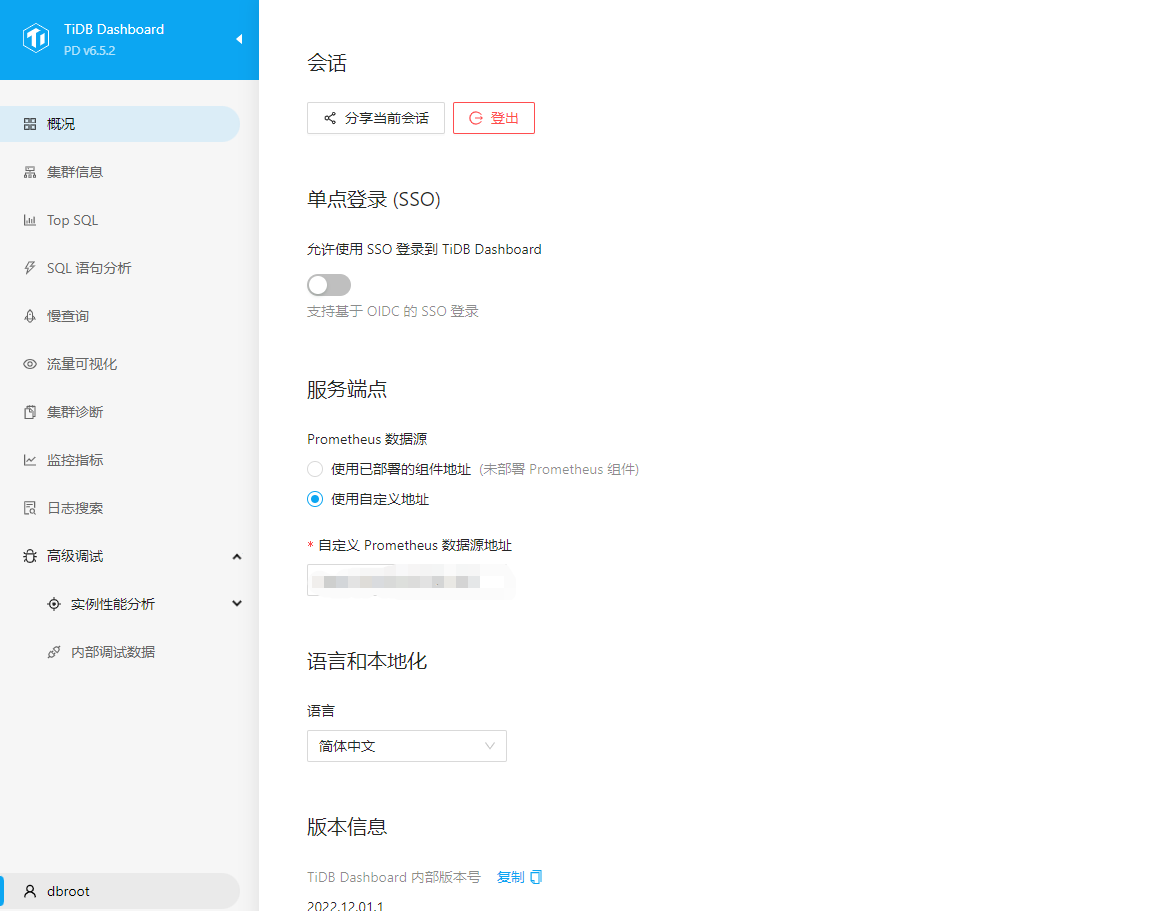
I am not using Prometheus, but instead using VM Metrics to monitor all my TiDB clusters. When using the PD dashboard, how should I configure my data source?
When configuring this data source from Grafana, it requires a username and password. How should I configure it into the dashboard? The data source address is also not a standard IP:port.
I just don’t want to have too many Prometheus instances, so I used VictoriaMetrics as a replacement. I also integrated MySQL, but in the dashboard section, you can only write the IP and port, not other URLs, and you can’t add an account and password. I haven’t found the metadata table for storing the dashboard or a way to configure this section.
I don’t need the dashboard to integrate with my own MySQL, I just hope that the dashboard can provide monitoring services for this TiDB group based on the tags I provide from my port.