Note:
This topic has been translated from a Chinese forum by GPT and might contain errors.
Original topic: 在新的 grafana 上如何找到已经部署集群的 OverView?
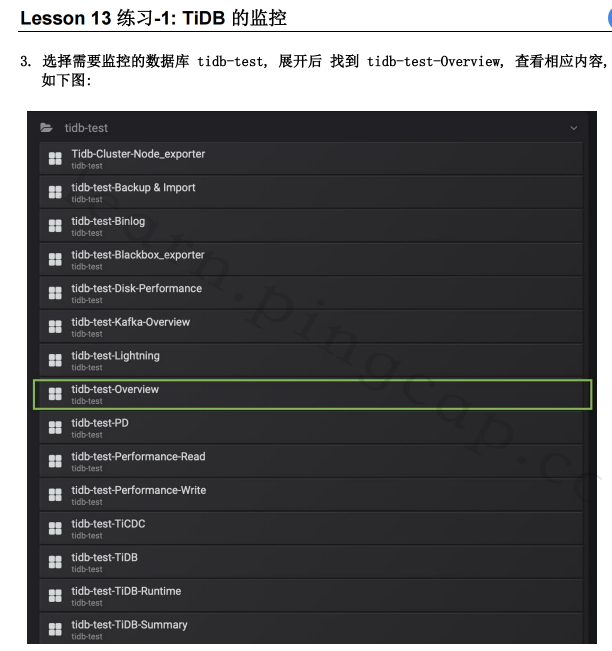
After installing the cluster through tiup cluster deploy, how can I find the following Overview on Grafana?
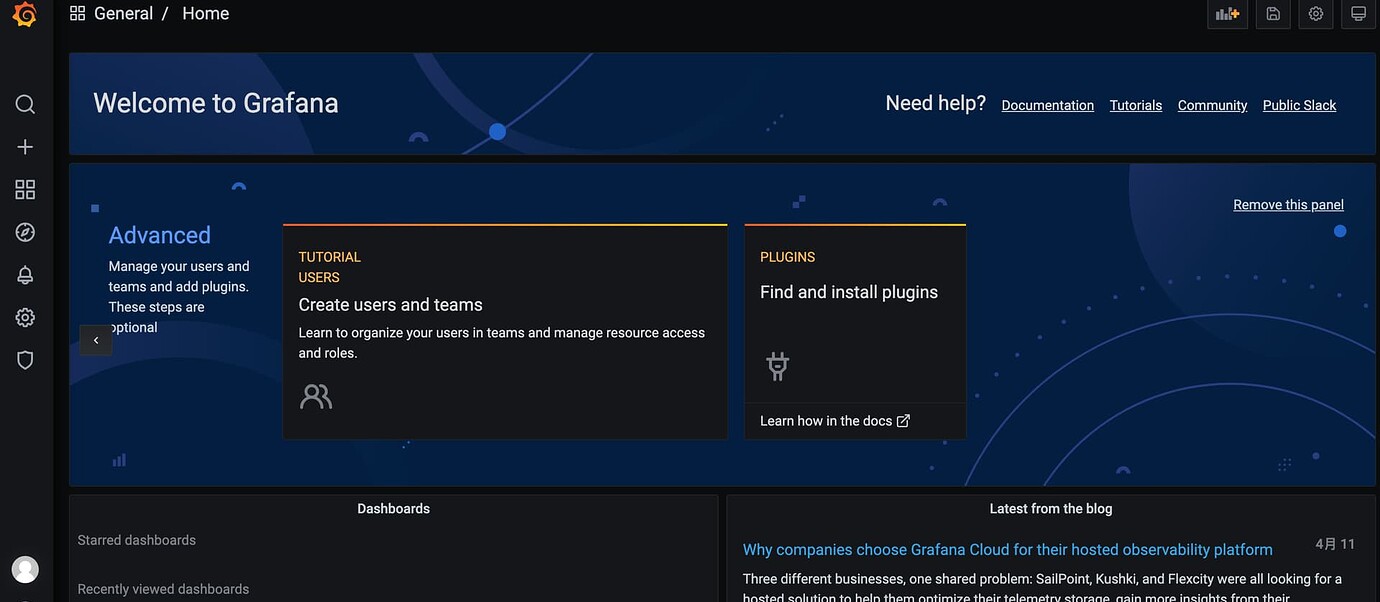
Currently, after logging in, the page is empty, as shown below:
Clicking here also allows you to view these panels.
You need to import the template yourself.
Click on home, and there will be a tidb-test (test cluster name) folder. All the monitoring panels are under this folder.
On the right side, there is a search icon. Click the icon and select the folder with the cluster name to view it.
Click this icon to see it.
It needs to be associated with Prometheus and import the template. The official documentation is not very clear. However, once you understand the principle, you can still figure it out by tinkering with the interface according to the prompts.
Look for the data source configuration information, and take some time to check the Prometheus documentation.
Home, just a little tweaking here and there in my own cluster and it worked.
Resolved, thank you for your attention.
This topic was automatically closed 60 days after the last reply. New replies are no longer allowed.