Note:
This topic has been translated from a Chinese forum by GPT and might contain errors.Original topic: Coprocessor请求慢如何进一步排查
[TiDB Usage Environment] Production Environment
[TiDB Version] 5.3.2
[Encountered Problem]
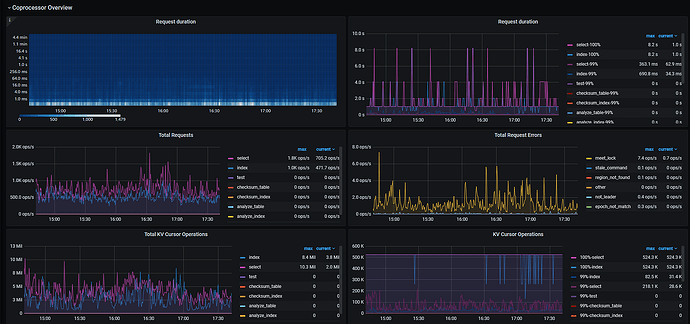
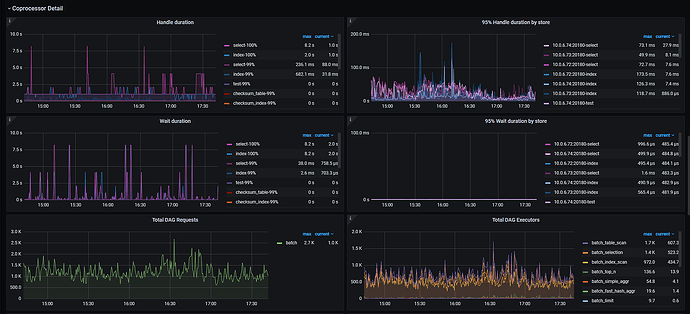
During the investigation of slow SQL, it was found that the Coprocessor monitoring was abnormal, with high latency and significant jitter:
Here is a possibly related execution plan:
	id                	task     	estRows	operator info                                                                                                                                                                  	actRows	execution info                                                                                                                                                                                                                                                                                                                                                         	memory 	disk
	IndexLookUp_10    	root     	3      	                                                                                                                                                                               	1      	time:7.87s, loops:2, index_task: {total_time: 7.86s, fetch_handle: 7.86s, build: 1.35µs, wait: 1.86µs}, table_task: {total_time: 5.33ms, num: 1, concurrency: 5}                                                                                                                                                                                                     	31.8 KB	N/A
	├─IndexRangeScan_8	cop[tikv]	3      	table:xxx, index:IDX_ba_cust_ordertype(partner_id, cust_id, order_type_id), range:["kejie" "1200002260" "020291","dfa" "1200002260" "020291"], keep order:false	1      	time:7.86s, loops:3, cop_task: {num: 1, max: 7.86s, proc_keys: 1, rpc_num: 1, rpc_time: 7.86s, copr_cache_hit_ratio: 0.00}, tikv_task:{time:0s, loops:1}, scan_detail: {total_process_keys: 1, total_process_keys_size: 118, total_keys: 2, rocksdb: {delete_skipped_count: 0, key_skipped_count: 1, block: {cache_hit_count: 9, read_count: 0, read_byte: 0 Bytes}}}  	N/A    	N/A
	└─TableRowIDScan_9	cop[tikv]	3      	table:xxx, keep order:false                                                                                                                                      	1      	time:5.2ms, loops:2, cop_task: {num: 1, max: 5.13ms, proc_keys: 1, rpc_num: 1, rpc_time: 5.12ms, copr_cache_hit_ratio: 0.00}, tikv_task:{time:0s, loops:1}, scan_detail: {total_process_keys: 1, total_process_keys_size: 262, total_keys: 1, rocksdb: {delete_skipped_count: 0, key_skipped_count: 0, block: {cache_hit_count: 8, read_count: 0, read_byte: 0 Bytes}}}	N/A    	N/A
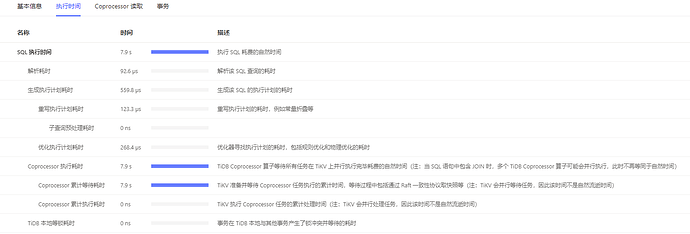
Single table query, with a total of only over 50,000 rows, and the hit index has very high selectivity, but the coprocessor processing time is very long:
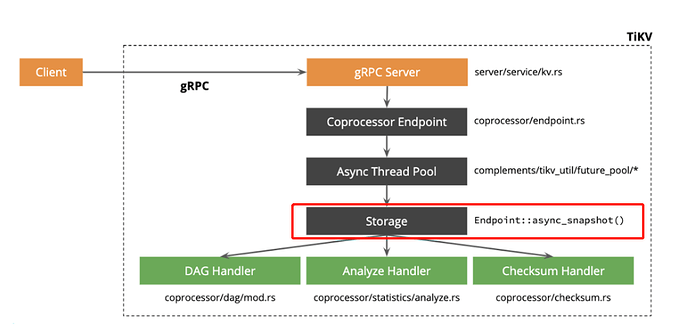
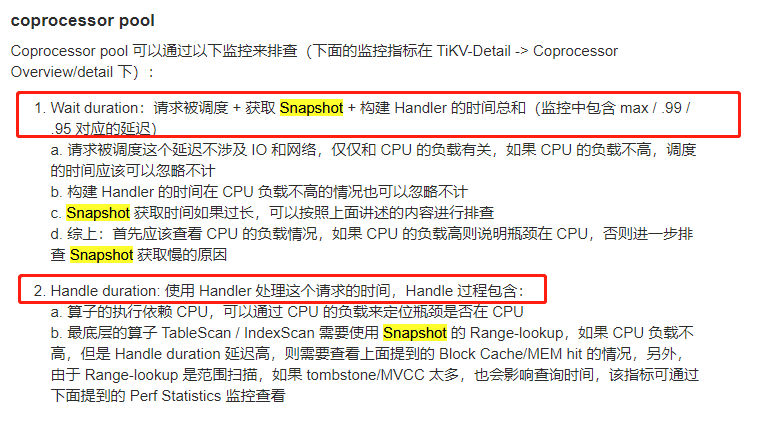
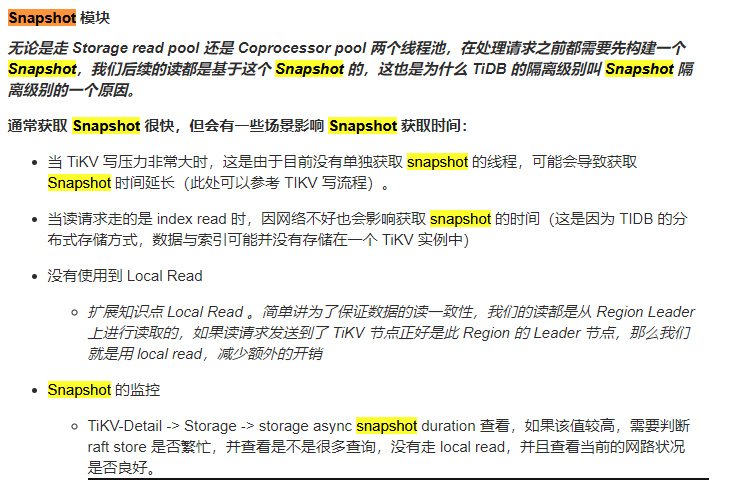
What should be the next step in the investigation? ![]()
![]()
Attached are the complete TiKV monitoring data:
tidb-TiKV-Details_2022-09-23T09_57_24.748Z.json (900.0 KB)
