How to Handle Out of Memory (OOM) When Loading Statistics Information

Note:
This topic has been translated from a Chinese forum by GPT and might contain errors.

Original topic: 加载统计信息内存OOM如何处理

| username: yuqi1129

【TiDB Usage Environment】Production Environment or Test Environment or POC
Production
【TiDB Version】
5.0.2
【Encountered Problem】
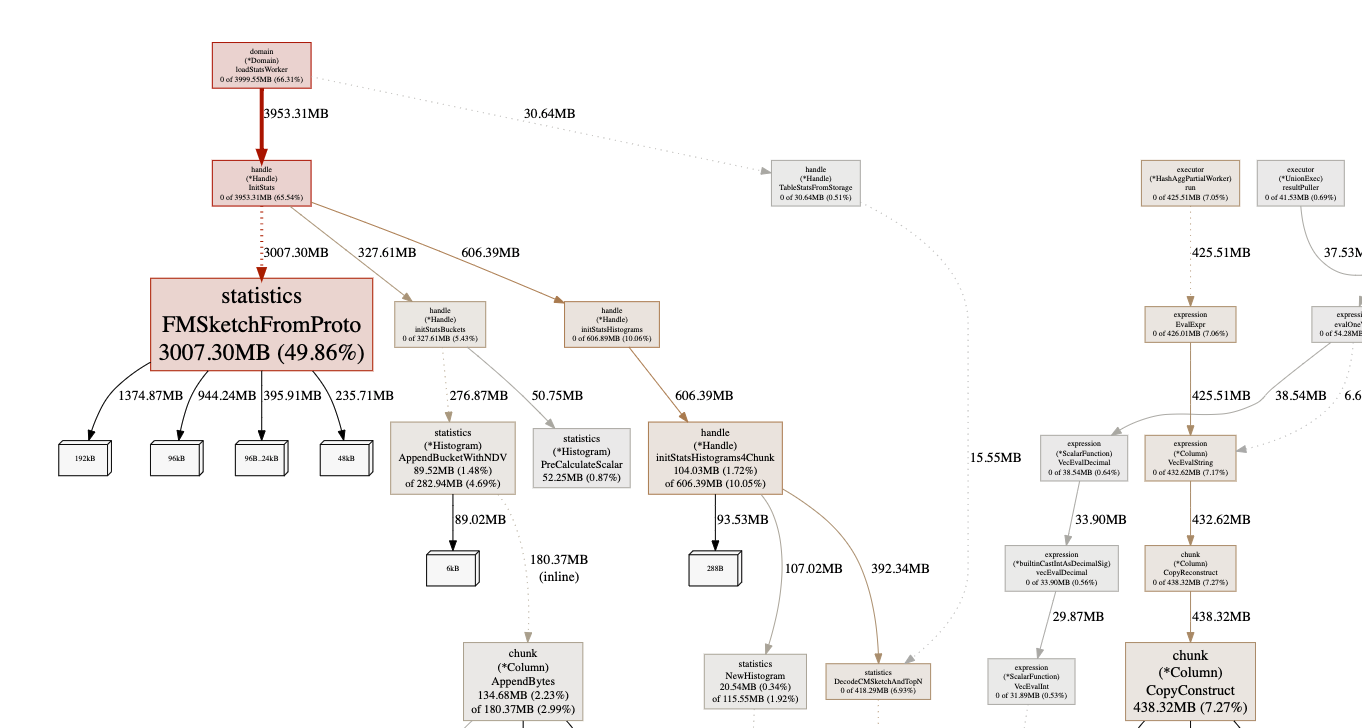
Suddenly, TiDB memory usage increased to over 80% of the entire machine (the physical machine has 128G).
This is the corresponding memory graph. I would like to ask how to handle this situation?


【Reproduction Path】What operations were performed that caused the issue
【Problem Phenomenon and Impact】

【Attachments】

Please provide the version information of each component, such as cdc/tikv, which can be obtained by executing cdc version/tikv-server --version.

| username: caiyfc | Original post link

In this situation, you need to first check the analyze version. If the analyze version is 2, this kind of OOM issue can occur, so you need to set the analyze version to 1.

| username: ddhe9527 | Original post link

Does version 5.0.2 have the system variable tidb_analyze_version? If it does, try changing it to 1. It seems that the statistics information in version v2 has an OOM bug in the early versions of TiDB v5.

| username: yuqi1129 | Original post link

Isn’t this supposed to occur during the analyze table period? I see that there is no auto analyze table running at this time. This is an automatic load of statistical information. Will this also cause OOM?

| username: yuqi1129 | Original post link

It should have been set to 1 a long time ago.

| username: yilong | Original post link

  1. From the profile, it shows only 3G of memory consumption, but the physical machine has 128G of memory, which doesn’t match.
  2. Is there only one tidb-server deployed on the physical machine? Where did you see the increase in tidb-server memory?
  3. If so, please provide the runtime monitoring of this tidb-server from Grafana.
| username: yuqi1129 | Original post link

  1. Is there only one tidb-server deployed on the physical machine? Where did you see the tidb-server memory increase?
    I saw this through the ps process, then took a memory stack, which is the one above.

  2. I’ll look for this monitoring, thanks a lot :+1: