Note:
This topic has been translated from a Chinese forum by GPT and might contain errors.
Original topic: 上游15万的更新操作,下游被放大到7000万的更新,如何提升ticdc的到下游tidb集群之间的数据同步速度,减小数据延迟。
Upstream has 150,000 update operations, while downstream is amplified to 70 million updates. How can we improve the data synchronization speed between TiCDC and the downstream TiDB cluster to reduce data latency?
-
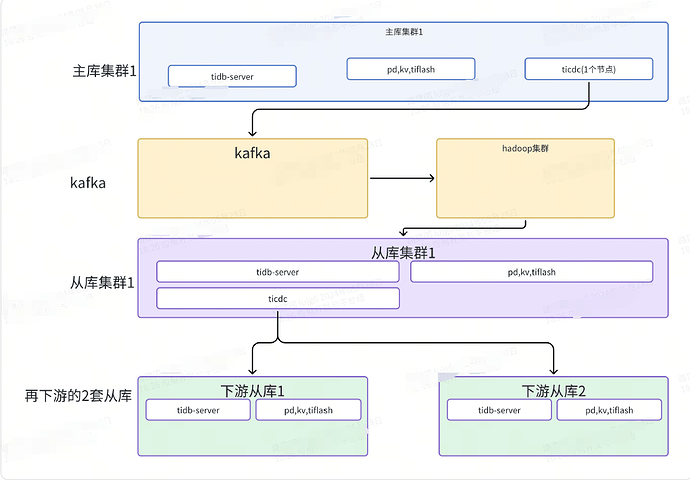
This is a simplified architecture diagram before the modification:
Figure 1
-
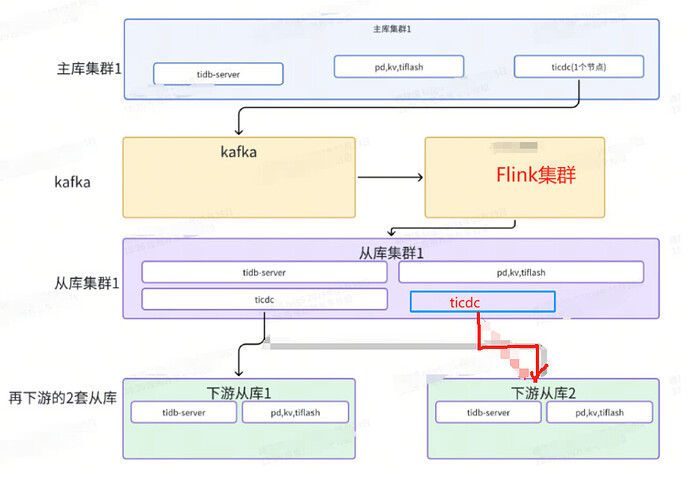
This is a simplified architecture diagram after the modification:
Figure 2
-
After adding a new CDC node, it was found that these two CDC nodes form a high-availability replication. Previously, the task list on CDC1 was synchronized to CDC2, which could not achieve the replication requirements of Figure 2.
Is there a better way to improve the data synchronization speed between TiCDC and the downstream TiDB cluster to reduce data latency?
Currently, each individual wide table is used as a Changefeed task for a CDC, with the core configuration as follows:
# Specifies the upper limit of memory quota for this Changefeed in the Capture Server. The excess usage part
# will be preferentially reclaimed by the Go runtime during operation. The default value is `1073741824`, which is 1 GB.
memory-quota = 1073741824
[mounter]
# The number of threads for mounter to decode KV data, the default value is 16
worker-num = 32
There are experts who have written optimization articles that you can refer to:
专栏 - 10倍提升-TiCDC性能调优实践 | TiDB 社区…
Try the following TiCDC configuration adjustments:
- Worker Count: Increase the
worker-count value in the sink-uri parameter to increase the number of worker threads for downstream data writing, thereby improving write speed.
- Batch Size: Appropriately increase the
batch-size parameter in the sink-uri to allow each batch to process more transactions, reducing the number of network round trips. However, be careful not to set it too high to avoid affecting database stability.
- Memory Buffer: Adjust the
memory-buffer-size parameter to increase the memory buffer size, which can temporarily store more data to be synchronized, reducing disk I/O. However, monitor it to prevent memory overflow.
I have read this article, it is about the v5.3.0 version of TiCDC, and the idea should be similar. However, I noticed that he adjusted the work-count to 1250 at that time, which seems a bit high.
In version v6.5.0, the corresponding parameters are these two:
# Specifies the upper limit of the memory quota for this Changefeed in the Capture Server. For the excess usage part,
# it will be preferentially reclaimed by the Go runtime during operation. The default value is `1073741824`, which is 1 GB.
# memory-quota = 1073741824

[mounter]
# The number of threads for the mounter to decode KV data, the default value is 16
# worker-num = 32
I am also planning to give it a try. No wonder the memory usage on the monitoring graph has been consistently low. In our production environment, we have configured synchronization tasks for 6 large wide tables, with each ID occupying 1G, so it should be around 6G at most. However, the peak memory usage of cdc reaches 14G.
You can also achieve miracles with great effort. The bottleneck of CDC should be at the sorter stage. You can expand several more CDC nodes and split the CDC synchronization tasks into multiple parts to distribute the pressure to different servers.
After adjusting the parameters, I found that the throughput rate did not improve.
Could it be related to the versions of my several clusters?
- The upstream primary cluster version is: v6.5.0
- The downstream two replica clusters’ versions are: v6.1.5 and v7.5.0
From the monitoring graph, the processing speed is around 3000/second, which is far lower than the 36000/second from CDC to Kafka. Theoretically, what should be the normal speed of CDC to the downstream TiDB cluster?
Do you have a bottleneck in the downstream TiDB?


