How to Interpret TiKV Auto GC SafePoint Monitoring Metrics, I Don't Understand

Note:
This topic has been translated from a Chinese forum by GPT and might contain errors.

Original topic: TiKV Auto GC SafePoint监控指标怎么解读,没看懂

| username: 近墨者zyl

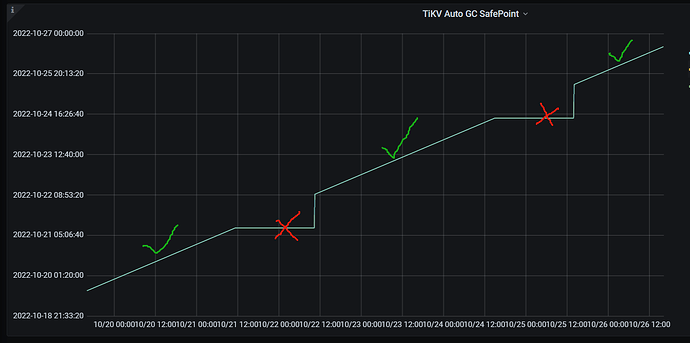
How to view the TiKV Auto GC SafePoint metrics? I read a technical article that mentioned the current GC safe point has not advanced and is blocked at about 4 hours ago. Historical monitoring often shows similar situations (TiKV Details → GC → TiKV Auto GC SafePoint).

Screenshot as follows:

Why is it blocked 4 hours ago?

Article link: 专栏 - 一次TiDB GC阻塞引发的性能问题分析 | TiDB 社区
| username: jansu-dev | Original post link

  1. gc safepoint blocked by a running session indicates that the automatic advancement of the gc safepoint is blocked by a running transaction; details of the gc mechanism can be found in the article linked by the author → TiDB 写入慢流程排查系列(六)— GC 机制 - TiDB 的问答社区
  2. Why is the gc safepoint blocked by a session? → This can be seen from the description in this PR and Issue. For example, if a transaction takes a long time to execute, and the background gc safepoint advances normally, clearing the locks and data of this transaction, it will definitely cause the transaction to abort. Therefore, the gc safepoint will be blocked by the transaction.
  3. As for the author’s description of “blocked about 4 hours ago,” it should be a phenomenon seen from the panel. I guess it might be related to the large delete limit sql that the author found.
| username: system | Original post link

This topic was automatically closed 60 days after the last reply. New replies are no longer allowed.