Note:
This topic has been translated from a Chinese forum by GPT and might contain errors.
Original topic: TIDB v6.1.7版本如何获取affected row by type的监控数据呢
[TiDB Usage Environment] Production Environment
[TiDB Version] v6.1.7
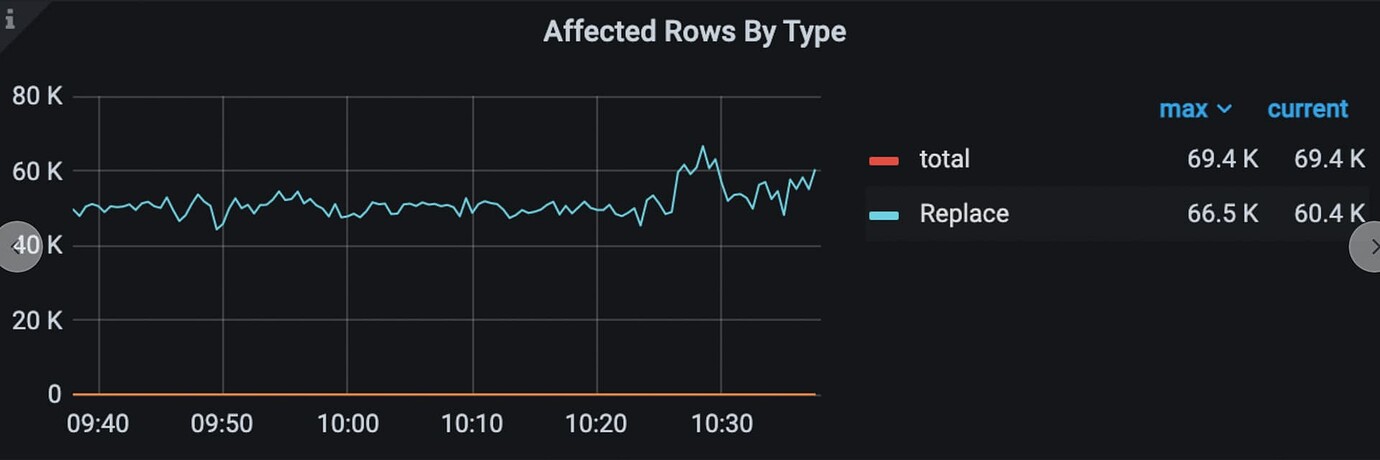
[Issue Encountered: Phenomenon and Impact] How can I obtain the monitoring data for affected rows by type in TiDB v6.1.7? I see that this monitoring is available in version v7.1.0, as shown in the image below:
Lower versions don’t have it. Check if there’s a metric with the same name in Prometheus metrics, and you’ll know. I also discovered recently that version 7.0 has many more detailed metrics.
In a production environment, upgrades should be approached with caution…
I’ll call the metric interface to check. What version are you mainly using online?
This version should not have this monitoring item.
It’s not absolutely necessary, so there’s no need to upgrade. Stability is more important.
First, use the admin account to check the 7.1 monitoring formula, then use this command to check: curl http://{prometheus_node}/api/v1/label/__name__/values. If there is a metric, you can add it yourself; if not, you will need to upgrade to have it.
The returned interfaces include: re_metrics, AsyncMetrics, and waterfall_metrics. None of them can be used, right?
Be careful when operating in the production environment.