Note:
This topic has been translated from a Chinese forum by GPT and might contain errors.
Original topic: slow log 慢查询 Prewrite_time耗时时间长 如何优化解决
[TiDB Usage Environment] Production Environment
[TiDB Version] v4.0.7
[Reproduction Path] Slow log slow query Prewrite_time takes a long time. How to optimize and solve what situations might occur.
[Encountered Problem: Problem Phenomenon and Impact]
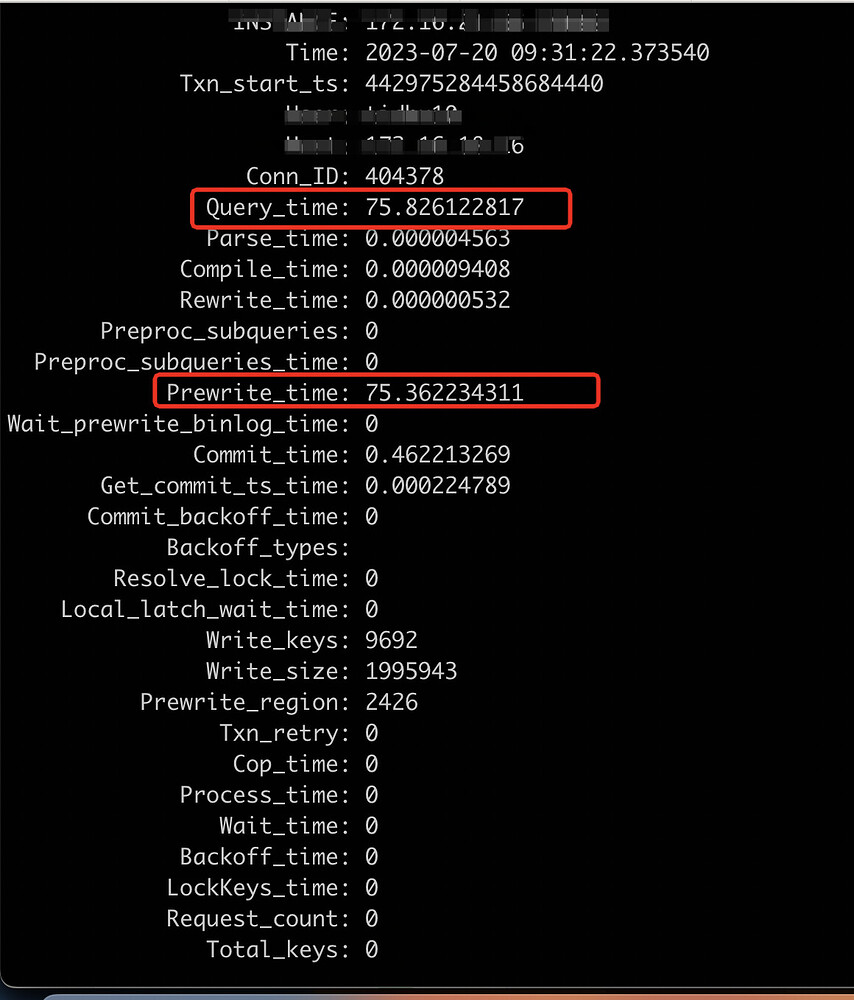
select * from information_schema.cluster_slow_query where is_internal = false order by query_time desc limit 2\G
[Attachment: Screenshot/Log/Monitoring]
Optimistic mode, pessimistic mode?
Can you provide an SQL explain plan for us to see?
Post the SQL and let’s take a look.
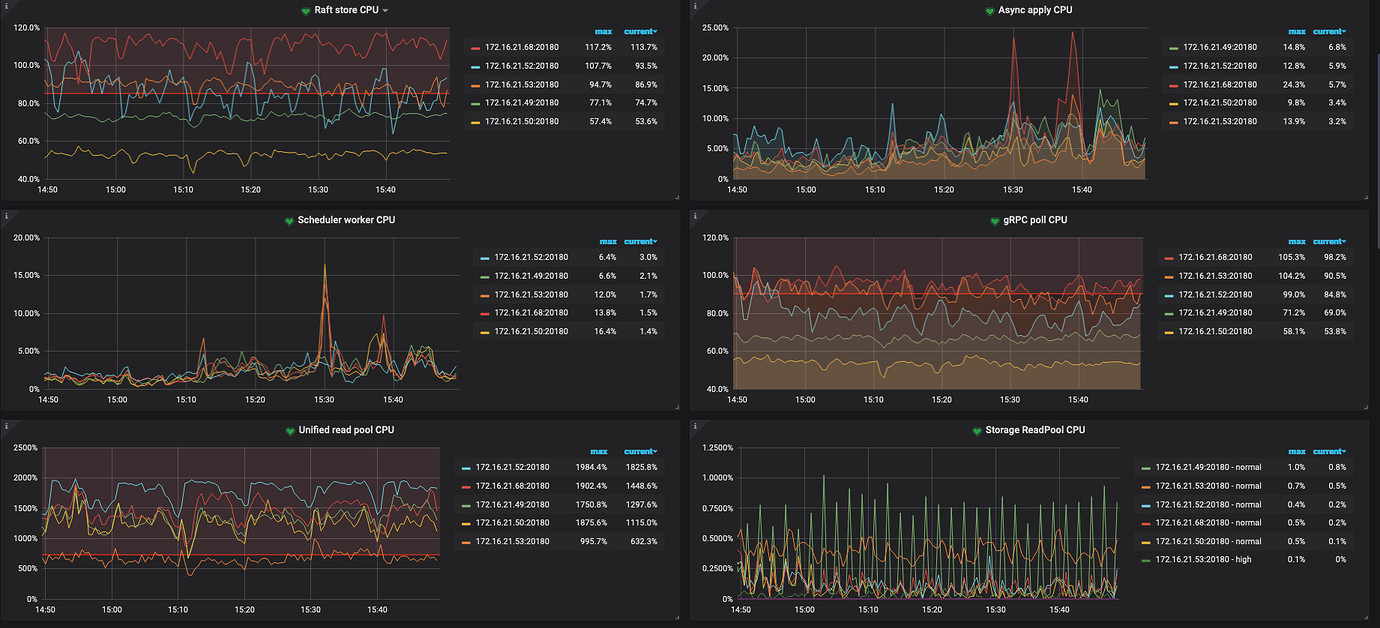
In addition to SQL, you also need to check the thread CPU of tikv-details.
Check lock contention and indexes.
Prewrite involves writing data from TiDB to TiKV. First, check the disk performance of TiKV, the CPU of TiKV, and the network latency from TiDB to TiKV.
Is it consistently slow or only occasionally? I have encountered this issue before, and it was due to the IO impact from other tables.
Prewrite slowness is most likely due to slow disk I/O. Check disk usage in the monitoring system.
How to check disk performance
To check disk performance, you can use disk performance tools or look at network latency in node exporter, specifically checking blackexport.
The graphs from the past 7 days, the data for the other 5 nodes is similar.
This range is a bit too large. Looking at the time point near the execution of this slow SQL, the monitoring data is approximately one point every 15 seconds.
Disk sdb
Slow query appeared at 9:21
Check the TiDB-KV request monitoring and network latency monitoring using blackexporter. If not available, check in nodeexporter.