Note:
This topic has been translated from a Chinese forum by GPT and might contain errors.
Original topic: 如何优化TiFlash存算分离架构下载速度/本地查询效率
The SQL query is: select count(1) from table_ch ch where ch.create_time >= '2024-01-01' and ch.create_time < '2024-02-01' and ch.capital_mode = '8' and ch.account_id != '';
| Test Case |
Query Time |
Remarks |
6.5.8 |
0.707 s |
|
7.5(local) |
0.855 s |
|
7.5(s3) no-cache |
72.605 s |
Total cache data size is 5.6 G, maximum S3 download speed is 190 MB/s |
7.5(s3) cached |
2.613 s |
|
As we can see, after adopting the storage-compute separation architecture, the first query is particularly slow, seemingly stuck at the speed of downloading data from S3. Once the data is cached to the compute node, subsequent queries are faster compared to the first one but still about three times slower than in local mode.
I have a few questions:
- Are there any parameters that can adjust the speed or concurrency of downloading from S3?
- Why is the query still much slower than the normal mode even after the data is cached locally?
- Is there any way to proactively keep certain tables’ data always cached locally? (To ensure the query efficiency of certain tables and prevent severe degradation)
Manually triggering a full table scan on certain tables should trigger caching to the local, but I’m worried that once the cache.capacity limit is reached, it will be evicted from the cache.
There is another point, I don’t know why the same query is actually faster in 6.5.8 compared to 7.5.0. Didn’t 7.1 have the delayed materialization optimization? Theoretically, it should be faster, right?
Since downloading data from S3 is slow, why not store the data on TiFlash nodes?
We are currently testing the TiFlash storage-compute separation architecture to see if there is still room for optimization. If the current efficiency is indeed what it is, we will definitely be cautious about whether to use the new architecture.
In TiDB’s storage-computation architecture, TiKV/TiFlash represents ‘storage’, while ‘computation’ is handled by the TiDB Server. This is inherently a storage-computation separation architecture. Distributed systems inherently use multiple nodes with local storage to achieve high concurrency, but they also experience increased storage capacity due to multiple replicas. The cost of cheap local storage can offset some of these costs. If storage nodes like TiFlash do not use local storage and instead access object storage like S3 over the network, what is the point of having distributed storage nodes? Wouldn’t it be better to have the TiDB Server directly access S3?
Your understanding is correct, but if TiDB can achieve access efficiency on S3 similar to that of local storage, wouldn’t that be even better?
Additionally, TiDB Cloud is now based on S3, which is also a development direction for TiDB. Moreover, leveraging the characteristics of S3, it has created the killer feature called Branch. Each has its own advantages, so we shouldn’t dismiss any of them outright.
Here is the official promotional article: 专栏 - TiDB Serverless Branching:通过数据库分支简化应用开发流程 | TiDB 社区. It’s not just for high-performance OLTP scenarios; TiDB is also used in some AP-type scenarios where query latency is not sensitive, but cost is very important.
Have you considered the cost? From a theoretical perspective, it’s impossible for efficiency to be higher after doing additional work compared to doing it directly, unless extra costs are incurred.
If OLAP had no performance requirements, columnar databases and real-time streaming OLAP would not have developed.
Have you considered the disk I/O?
After testing, when set tidb_opt_enable_late_materialization=off; disables late materialization, the speed is 0.926 s, which is almost the same as the local disk TiFlash in version 7.5.
Additionally, I also tried setting storage.remote.cache.capacity to 0, and the speed was much faster than when it was not set to 0, finishing in 16 seconds. It seems that it didn’t write to the local disk and directly stored everything in memory. Could it be that the data is first written from S3 to the local disk and then read from the local disk into memory for computation?
It would be best to provide the execution plan, and also whether the table has already been stored in TiFlash.
If you don’t use this local cache, wouldn’t it all have to be stored in memory? This would put a serious strain on the memory of the TiFlash node machines…
After testing, when set tidb_opt_enable_late_materialization=off; disables late materialization, the speed is 0.926 s, which is almost the same as the 7.5 local disk TiFlash.
Uh, it’s not caused by this issue. After re-scaling and re-synchronizing the TiFlash replica, I found that turning on/off late materialization has little impact on query latency. The first query takes more than 70 seconds, and after caching, the second query takes more than 2 seconds. After a period of time (indicated by the disappearance of S3 read/write requests in the monitoring panel), the first query only takes 16 seconds, and after caching, the second query takes about 0.9 seconds. After several queries, it can even become 0.7 seconds.
The corresponding CPU profile is:
profiling-write-node-during-query.zip (95.4 KB)
profiling-comput-node-during-query.zip (164.1 KB)
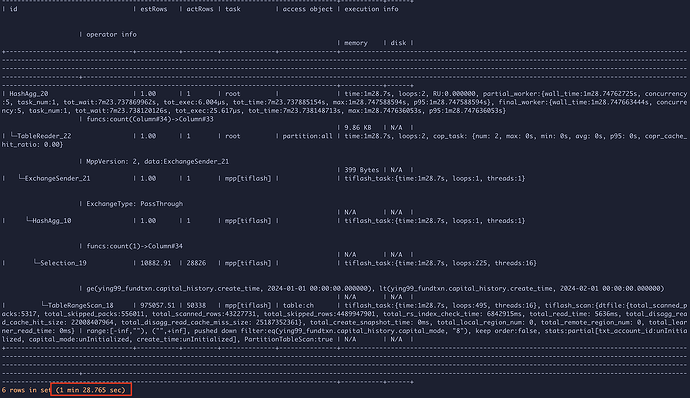
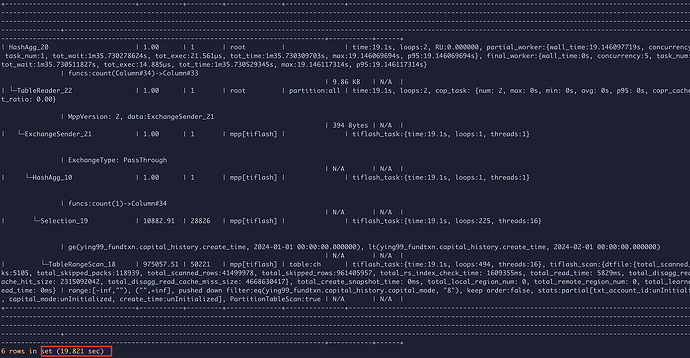
The query plans for both are as follows:
Initial query plan:
Query plan after stabilization:
Comparing the execution plans, it was found that before stabilization, total_skipped_rows/total_skipped_packs was about 5 times that of after stabilization, while the actual total_scanned_rows/total_scanned_packs did not differ much. This is because after adding the TiFlash replica, there were more file fragments. Even after the TiFlash replica became available, TiFlash continued to read and write to S3 for 3 to 4 hours, even in a static state with no data being written, before it stopped making requests to S3.
Before the query stabilizes, TiFlash is continuously performing segment merges. So it might be related to the segments being too small right after the import is completed. The specific reason needs to be investigated further.
After resizing the write-node again, the difference is indeed quite significant. By 19:30, all replicas had been uploaded. After 3 hours of sorting, the API request has been deleted 3 times, and the current number of objects is still 1.78 times the stabilized amount.
This question is impressive and sophisticated, I’ve learned a lot.

