Note:
This topic has been translated from a Chinese forum by GPT and might contain errors.
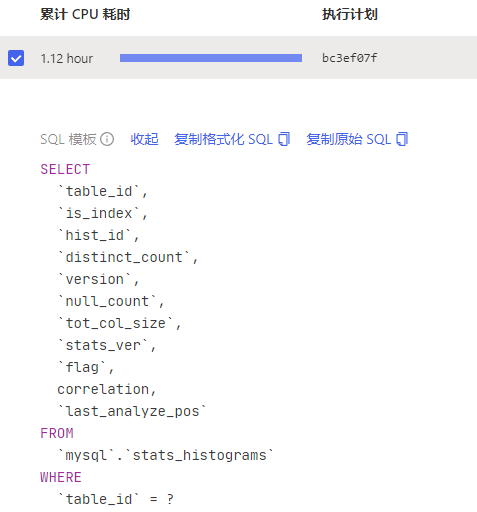
Original topic: 升级6.1.2后,大量stats_histograms 在一个tikv执行,如何优化
[TiDB Usage Environment] Production Environment
[TiDB Version] 6.1.2
[Encountered Problem: Phenomenon and Impact]
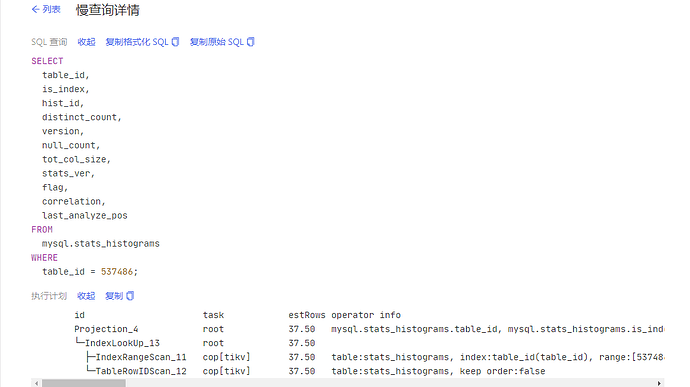
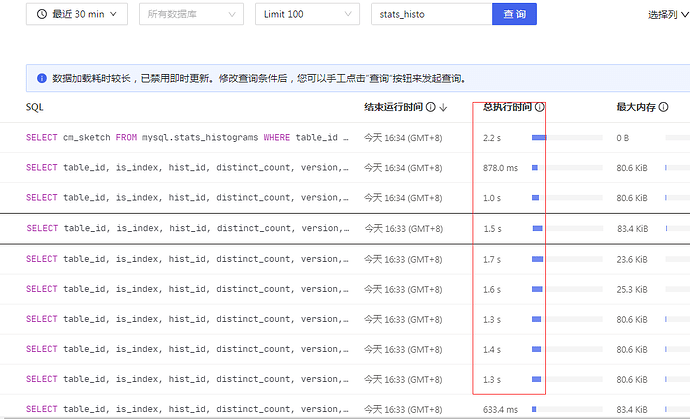
Upgraded from 5.4.2 to 6.1.2, found that statistics information is only running on one TiKV, causing a hotspot.
How to optimize?
You can simply use split table or pd-ctl to perform region split on this table, and then manually schedule some regions to other nodes. However, you need to check if the execution volume of this SQL was also this high before the upgrade.
It wasn’t this high before the upgrade, and load-based splitting has also been configured.
It’s resolved, the CPU has returned to normal.
The reason was that before the upgrade, tidb_analyze_version was set to 1, and the default parameter for tidb_persist_analyze_options persistence was on, causing the statistics persistence to be ineffective. Try setting tidb_analyze_version to 2 and see.
Is there any way to clean this up quickly?
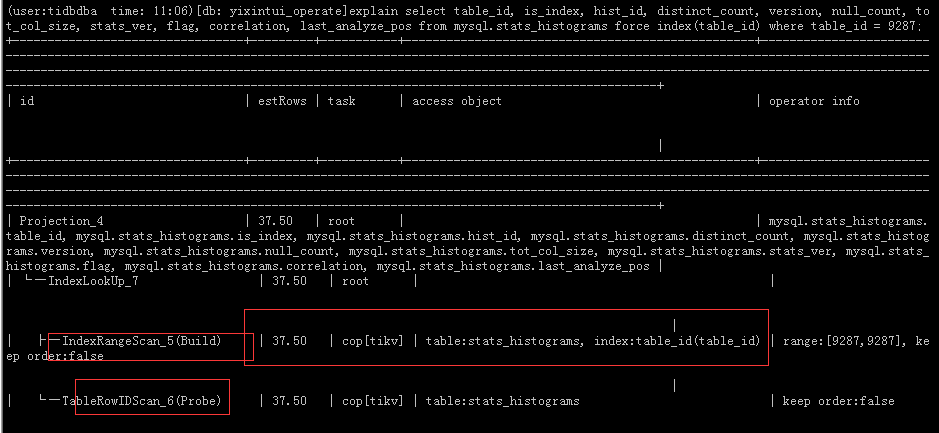
After adding the index, it still performs a full table scan.
I ran analyze table mysql.stats_histograms;
The execution plan for this table became normal. The TiKV CPU usage also decreased a bit. I’ll keep observing.
Although the load has decreased somewhat, there are still a lot of read hotspots in the traffic visualization.
Additionally, after upgrading TiDB to 6.1.2, there have been more “Data too long for column ‘video_material’ at row” errors:
2022/11/17 11:29:25.359 +08:00] [INFO] [conn.go:1149] [command dispatched failed] [conn=985285563792585879] [connInfo=id:985285563792585879, addr:192.168.6.29:64675 status:10, collation:utf8mb4_general_ci, user:dspwrite] [command=Execute] [status=inTxn:0, au[types:1406]Data too long for column ‘video_material’ at row 1
Path:/data/tidb/tidblog/tidb.log
2022/11/17 11:29:02.969 +08:00] [INFO] [conn.go:1149] [command dispatched failed] [conn=985285563792585877] [connInfo=id:985285563792585877, addr:192.168.6.29:46303 status:10, collation:utf8mb4_general_ci, user:dspwrite] [command=Execute] [status=inTxn:0, au[types:1406]Data too long for column ‘image_material’ at row 1
How to track these hotspots for easier splitting?
Try checking through the region, it seems like this is the only way.
29g basically means no index was created.
This table has too much data, over 1.7 million records. Each table_id has 368 records. Are there any cleanup rules?
The store with high CPU usage is found to be related to this table.
SELECT count(*), r.db_name, r.table_name, r.type
FROM information_schema.tidb_hot_regions r
JOIN information_schema.TIKV_REGION_PEERS p
ON r.REGION_ID = p.REGION_ID
WHERE p.store_id IN (10)
GROUP BY r.db_name, r.table_name, r.type
ORDER BY count(*) DESC
LIMIT 20;
Index queries are also slow, how to clean up the data?
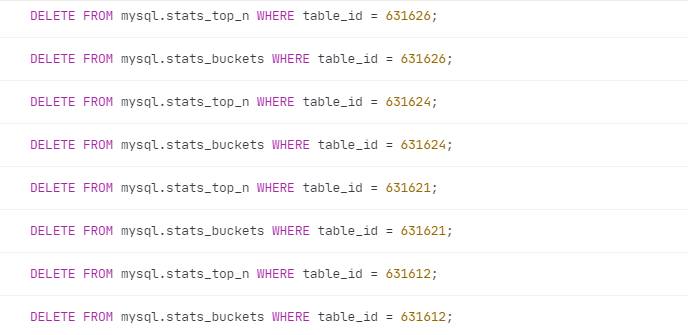
These are all junk data, right? They should be cleaned up. The table no longer exists, but the statistical data is still there.
(user:tidbdba time: 22:02) [db: yixintui_operate] select * from information_schema.tables where tidb_table_id=465581;
Empty set (3.02 sec)
(user:tidbdba time: 22:02) [db: yixintui_operate] select count(1) from mysql.stats_histograms where table_id=465581 limit 3;
±---------+
| count(1) |
±---------+
| 368 |
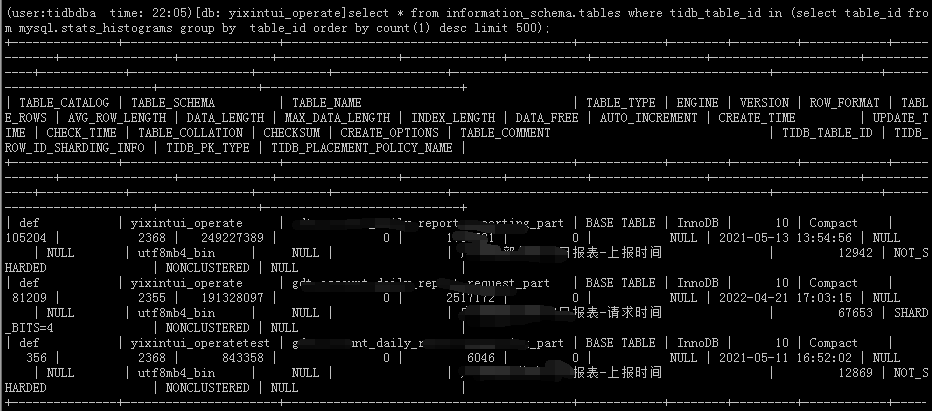
In the statistics table, among the top 500 tables by table_id, only 3 tables exist in information_schema.tables. The rest are junk data, either from deleted tables or renamed tables’ statistical data.
select * from information_schema.tables where tidb_table_id in (select table_id from mysql.stats_histograms group by table_id order by count(1) desc limit 500);
The system has only over 2000 tables, but the statistics table has 37929 different table_id entries.
(user:tidbdba time: 22:16) [db: test] select count(1) from information_schema.tables;
| count(1) |
| 2011 |
1 row in set (2.87 sec)
(user:tidbdba time: 22:18) [db: test] select count(distinct table_id) from mysql.stats_histograms;
| count(distinct table_id) |
| 37929 |
These two tables will be cleaned up, and possibly other tables need to be cleaned up as well.

select table_id, hist_id, tot_col_size from mysql.stats_histograms where is_index = 0;
This kind of SQL full table scan consumes a lot of system resources. The data in this table definitely needs to be cleaned up.
There are also many updates and selects where the table_id does not exist in information_schema.tables.
This topic was automatically closed 60 days after the last reply. New replies are no longer allowed.

