Note:
This topic has been translated from a Chinese forum by GPT and might contain errors.
Original topic: 如何查询监控中的Failed Query?
【TiDB Usage Environment】Production Environment
【TiDB Version】v6.5.3
【Reproduction Path】None
【Encountered Problem: Problem Phenomenon and Impact】
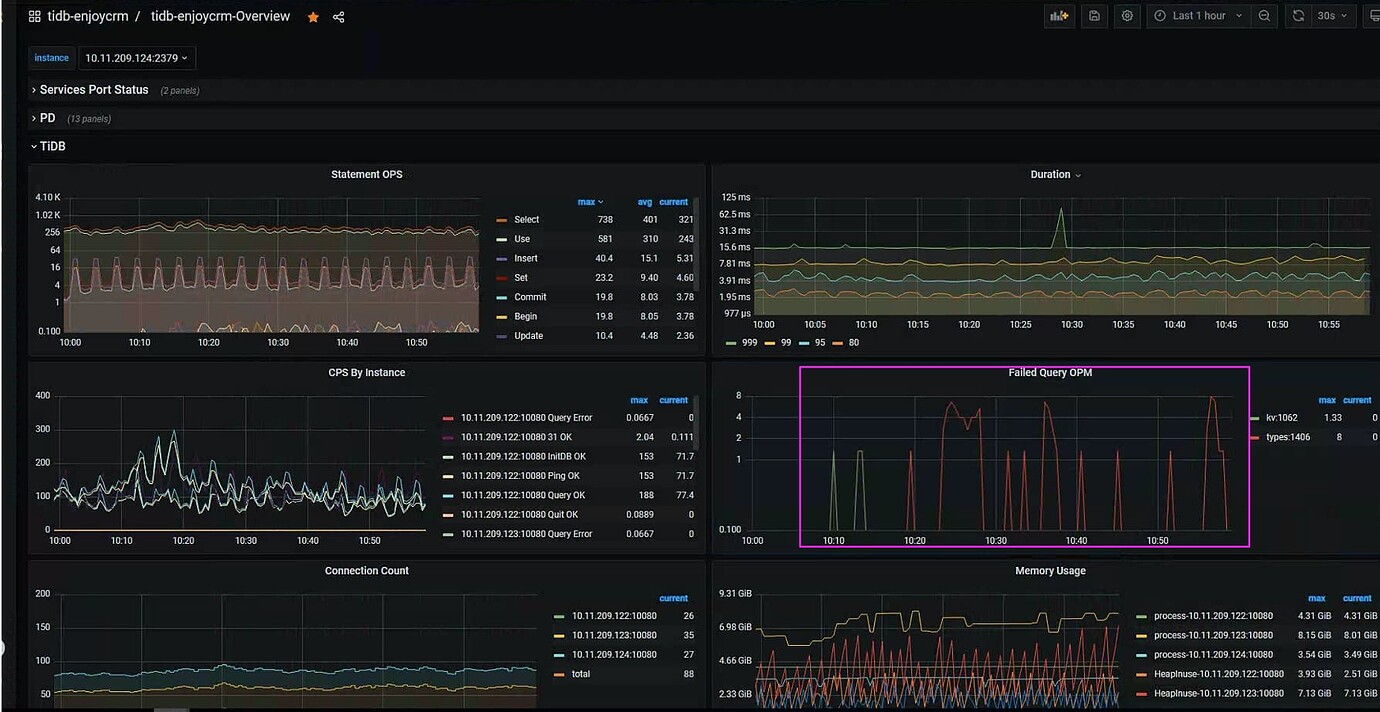
Grafana’s Failed Query OPM monitors types1406. What type of error is this? Is there a corresponding error code reference table? How can I find the corresponding SQL statement for the error?
Check the TiDB logs for this 1406.
The log level is set to error, but this keyword was not found.
In MySQL, error code 1406 is usually related to data truncation.
 Indeed, initially suspecting data truncation. However, I haven’t found the corresponding SQL, so I’m posting to see if there’s an error code reference list and a method to check the SQL.
Theoretically, tidb.log should definitely match 1406, unless you have changed the tidb log level.
Yes, we have changed the log level of the TiDB node to error.
 Boss, do you have a list of error codes for Failed Query OPM? This way, we can quickly identify the error types.
If it’s not here: 错误码与故障诊断 | PingCAP 文档中心, then it’s either unique to us or it was missed.
Or try a Google search.
There is no 1406 in here  Waiting for the source code expert to come up with a list.
What are you waiting for? You are the expert here 
Why change the log level to error? It’s troublesome to troubleshoot issues. Just configure log rotation.
It has been coordinated and changed to info. Let’s monitor it for a while~
Search for the keyword “dispatch” in the TiDB log, which refers to the SQL that caused the error, and then use 1406 for secondary filtering.
The definition of the error code shows that ErrDataTooLong = 1406.
 After adjusting the TiDB log level, search and take a look.