Note:
This topic has been translated from a Chinese forum by GPT and might contain errors.
Original topic: 如何在prometheus 中查询 TiCDC 同步任务状态
[TiDB Usage Environment] Production Environment
[TiDB Version] 5.0.4
[Encountered Problem: Issue Phenomenon and Impact]
Original Requirement: Trigger an alert when proactively pausing the ticdc synchronization task changefeed.
Problem:
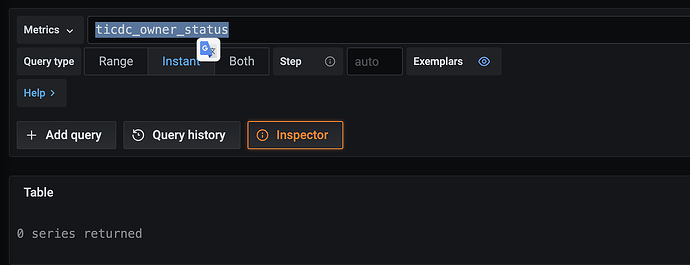
Checked Grafana and found a dashboard displaying “changefeed status,” but there is no data. Querying metrics also shows no data.
Check if there is any data in Prometheus. The default platform port for Prometheus is 9090.
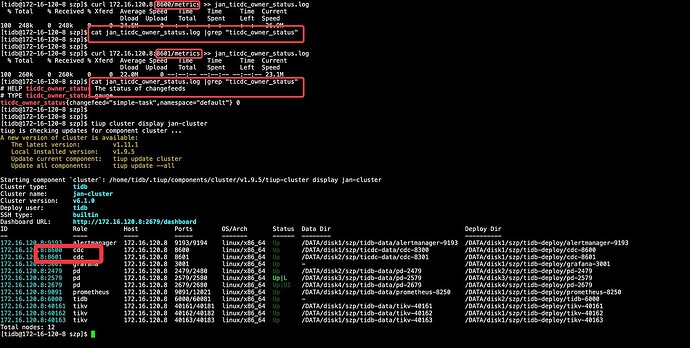
- Currently, there are two CDC nodes. After initiating a curl request, there are no ticdc_owner_status metrics.
curl 172.16.0.1:8300/metrics
curl 172.16.0.2:8300/metrics
- Checking the CDC logs, the following errors are found,
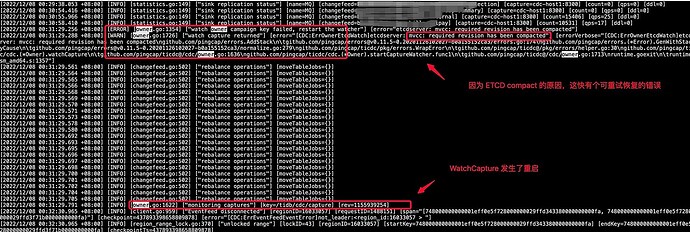
[2022/12/08 00:31:29.256 +08:00] [ERROR] [owner.go:1354] ["watch owner campaign key failed, restart the watcher"] [error="etcdserver: mvcc: required revision has been compacted"]
[2022/12/08 00:31:29.288 +08:00] [WARN] [owner.go:1726] ["watch capture returned"] [error="[CDC:ErrOwnerEtcdWatch]etcdserver: mvcc: required revision has been compacted"] [errorVerbose="[CDC:ErrOwnerEtcdWatch]etcdserver: mvcc: required revision has been compacted\ngithub.com/pingcap/errors.AddStack\n\tgithub.com/pingcap/errors@v0.11.5-0.20201126102027-b0a155152ca3/errors.go:174\ngithub.com/pingcap/errors.(*Error).GenWithStackByCause\n\tgithub.com/pingcap/errors@v0.11.5-0.20201126102027-b0a155152ca3/normalize.go:279\ngithub.com/pingcap/ticdc/pkg/errors.WrapError\n\tgithub.com/pingcap/ticdc@/pkg/errors/helper.go:30\ngithub.com/pingcap/ticdc/cdc.(*Owner).watchCapture\n\tgithub.com/pingcap/ticdc@/cdc/owner.go:1636\ngithub.com/pingcap/ticdc/cdc.(*Owner).startCaptureWatcher.func1\n\tgithub.com/pingcap/ticdc@/cdc/owner.go:1713\nruntime.goexit\n\truntime/asm_amd64.s:1357"]
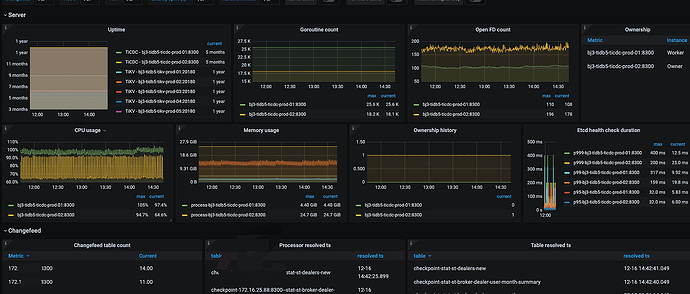
ErrEventFeedEventError theoretically should not interfere with the Owner election. Which Capture is currently shown as the Owner in the monitoring? Could you please upload the TiCDC panel and the Owner logs (for the recent period)?
- From the logs and panel, there doesn’t seem to be any interference with the normal synchronization function.
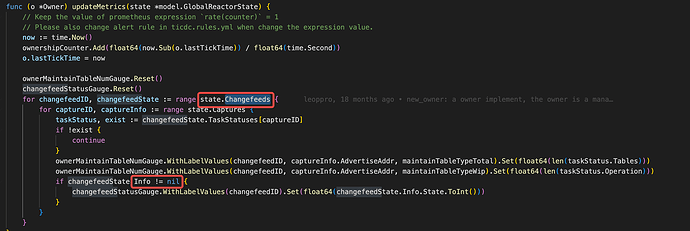
- Secondly, tracing back from the update metrics, there are too many possibilities, and the logs don’t provide much useful advice

- There is one part in the logs that might be related to this, as shown below.
In summary, the current suggestion is to restart all captures to see if it can be restored. It feels like a restart might solve the issue.
Additionally:
- When did the alerts start? Was it after 12:08?
- Was TiCDC upgraded?
- I didn’t pay attention to when it started.
- ticdc is deployed directly by tiup later.
Boss, how do you restart capture? tiup cluster restart cluster_name -R cdc?
What impact does restarting capture have?
Actually, the impact is not significant. After the restart, the connection between Capture and TiKV will reconnect, which will incur some overhead (rebuilding the connect stream for each Region). During this process, the synchronization progress will be somewhat affected, but other aspects should be fine. It’s better to restart during a business off-peak period.
After restarting the Capture on a single node in the offline environment, there is no ticdc_owner_status metric.
I’ll think of other solutions.
Complete capture monitoring through a Python script.
This topic was automatically closed 60 days after the last reply. New replies are no longer allowed.

