Note:
This topic has been translated from a Chinese forum by GPT and might contain errors.
Original topic: 系统库information_schema里面语句查询慢问题如何解决
[TiDB Usage Environment] Production Environment / Testing / PoC
[TiDB Version] v5.4.0
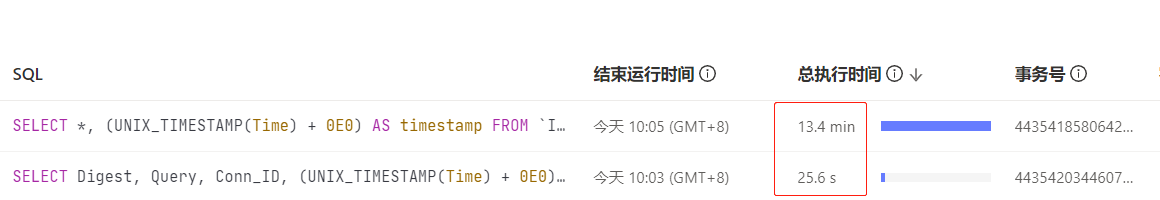
[Reproduction Path] Check in the slow query module and find that the query statements in the system information_schema database are very slow. How can this be optimized, as shown in the figure:
[Encountered Problem: Problem Phenomenon and Impact]
[Resource Configuration] Go to TiDB Dashboard - Cluster Info - Hosts and take a screenshot of this page
[Attachments: Screenshots/Logs/Monitoring]
System SQL can be ignored.
Go to each TiDB server and archive and clean up the slowlog logs. By default, all slow query log files are inserted into the slow_query table. If the data volume is too large, the queries will definitely be slow.
The slow query is probably due to the large amount of data in your slow queries. You can try cleaning it up.
The priority of system SQL execution is relatively low, just ignore it.
Sorry, I can’t access external links. Please provide the text you need translated.
The SQL that maintains internal metadata by the system can be basically ignored without affecting performance. However, locks will also be generated during internal maintenance. From TiDB version 6.5 onwards, metadata locks will be enabled by default. For DDL statements, when changing the metadata state, they will be blocked by old transactions involving the relevant metadata, which can affect performance. Metadata Lock | PingCAP Documentation Center If such locks cause performance issues, specific analysis and attention are required.
Find the slow_log path and then clean it up. The size of this table is related to the size of the slow log files in your cluster.
Should I directly remove this log file using rm?
Yes, you can delete any unnecessary historical slow SQL logs.