Note:
This topic has been translated from a Chinese forum by GPT and might contain errors.
Original topic: 监控面板指标意义不太理解
[TiDB Usage Environment] Production Environment / Testing / PoC
[TiDB Version]
[Reproduction Path] What operations were performed when the issue occurred
[Encountered Issue: Issue Phenomenon and Impact]
[Resource Configuration]
[Attachment: Screenshot/Log/Monitoring]
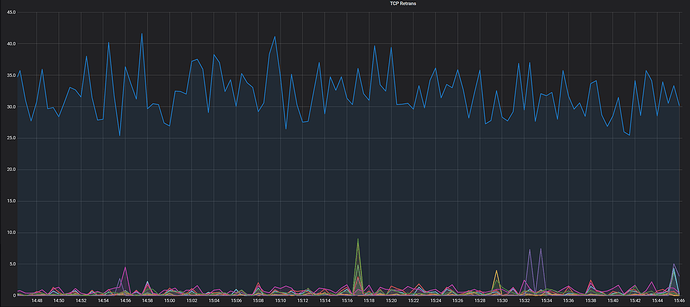
I don’t quite understand what this metric means. The official documentation explains it as * TCP Retrans: TCP retransmission count statistics
There is also this metric. The official documentation explains Open FD Count: the number of open file descriptors for each TiDB instance. I feel like I don’t quite understand it.
Documentation is unclear or incomplete, please submit according to the template below:
- Issue category: Content too brief, unclear description with ambiguities, incomplete steps
- Page where it appears: Link + Screenshot
- Issue description:
You can post it here according to this template: 文档优化 - TiDB 的问答社区
Documentation is unclear or incomplete
If you do not understand some parts of the documentation, please submit according to the template below to help us better understand your confusion:
I don’t quite understand the official explanation for these two panels; it’s too official.
- Open FD Count: The number of open file descriptors for each TiDB instance.
On a Linux system, file operations require opening the corresponding file descriptors through system-provided interfaces. This metric indicates how many files TiDB is operating on simultaneously within the statistical time window, typically including the four types of operations: CRUD (Create, Read, Update, Delete).
- TCP Retrans: TCP retransmission count statistics
TCP is a network communication protocol that ensures delivery results, meaning that within a certain time window, a failed message transmission will be resent to ensure delivery success. Multiple retransmission failures will result in a failure message being returned to the sender. This metric usually reflects the quality of the network.
My cousin is amazing. She’s even answering technical questions now. 
No, this is the response given by the teachers~ I’m just replying.
Teacher, if the TCP Retrans curve is higher, it means that the number of retries during this period is higher, indicating poorer network quality. Is this understanding correct? Open FD Count — It seems that this metric doesn’t convey much meaning, right? It’s just the number of open files. What significance does a higher number of open files represent?
This topic was automatically closed 60 days after the last reply. New replies are no longer allowed.


