In Production Environment: PD's Goroutine Count is Very High, How to Optimize and Troubleshoot the Issue?

Note:
This topic has been translated from a Chinese forum by GPT and might contain errors.

Original topic: 生产环境 :PD 的goroutine count 非常高, 如何优化和定位问题?

| username: Jarry_zhu

[TiDB Usage Environment] Production Environment
[TiDB Version] V6.5.0
[Reproduction Path] Operations performed that led to the issue
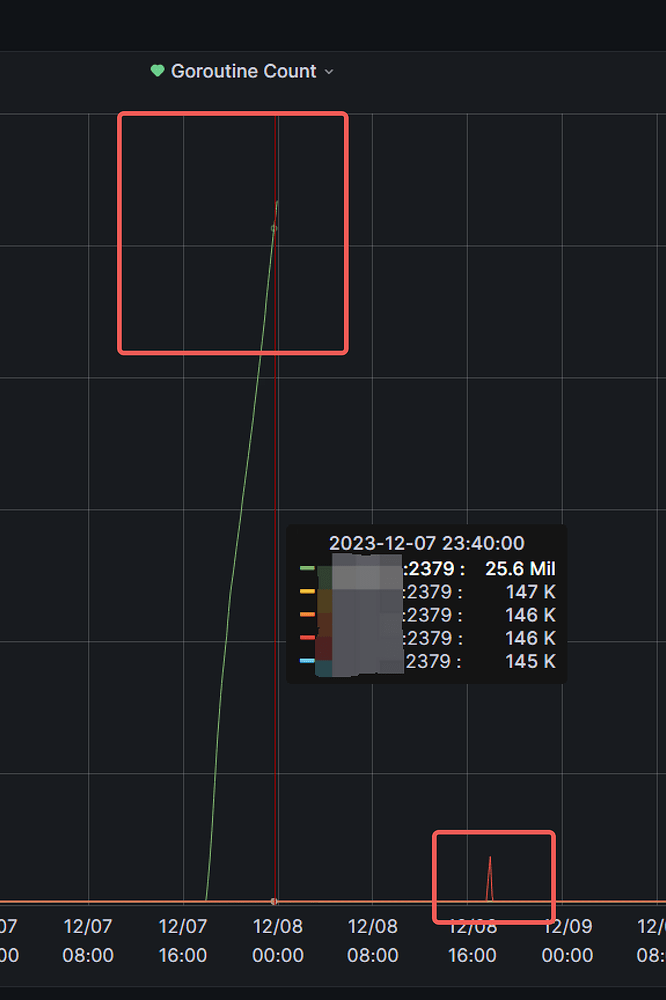
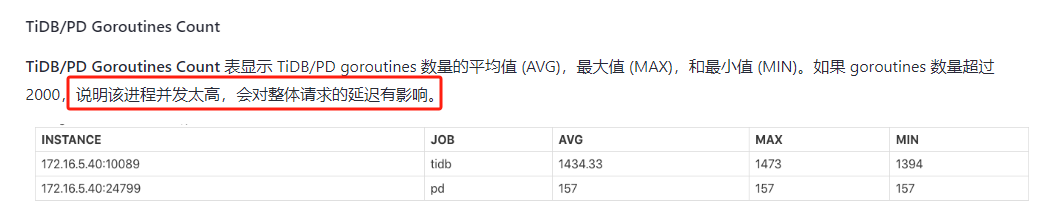
[Encountered Issue: Problem Phenomenon and Impact] PD’s goroutine count is extremely high
[Resource Configuration] Navigate to TiDB Dashboard - Cluster Info - Hosts and take a screenshot of this page
[Attachment: Screenshot/Logs/Monitoring]

| username: xfworld | Original post link

Take a look at the flame graph

curl http://<pd_address>:<pd_port>/debug/pprof/heap -o heap.log


You can also refer to

| username: Kongdom | Original post link

Check if there are slow queries in the statement analysis in the Dashboard.

| username: dba远航 | Original post link

Check the operation status of the business during this period. Are there any anomalies? For example: abnormal SQL processing, etc.

| username: 有猫万事足 | Original post link

You can use the dashboard to manually analyze what this PD is doing. Alternatively, logs would also work. Otherwise, it’s hard to figure out what’s going on.