Note:
This topic has been translated from a Chinese forum by GPT and might contain errors.Original topic: 在dashboard的慢日志列表里,点击详情时提示"record not found"
[TiDB Usage Environment] Poc
[TiDB Version] v6.2.0
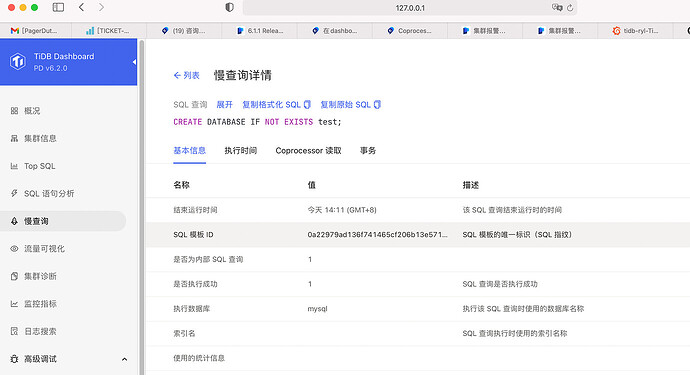
[Encountered Issue] When clicking on details in the slow log list on the dashboard, it prompts “record not found”
[Reproduction Path] Run a container using Docker, then install tiup, and specify the slow log path for TiDB when starting the playground. After running, go to the dashboard, click on the slow log list, and then select one to click on details.
[Issue Phenomenon and Impact]
The slow log list shows entries from the specified slow log file, and you can also find them in information_schema.cluster_slow_query through SQL queries, but the details page cannot be displayed, prompting “record not found”. However, if the slow log is generated during runtime, you can enter the details page.
It’s very strange, what could be the reason? Thank you.
[Attachments]
Please provide the version information of each component, such as cdc/tikv, which can be obtained by executing cdc version/tikv-server --version.
tiup: latest
v6.2.0
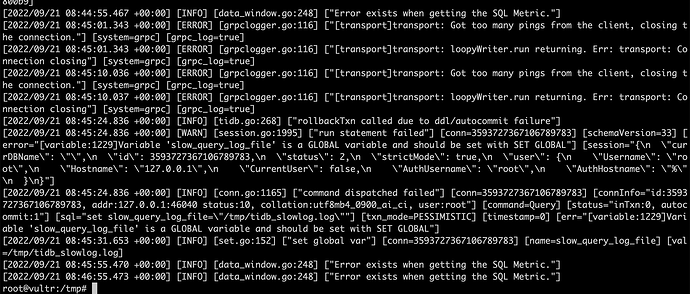
Looking at the log information, it seems to be “Error exists when getting the SQL Metric”
Dockerfile (415 bytes) docker-compose.yml (212 bytes)

