Note:
This topic has been translated from a Chinese forum by GPT and might contain errors.
Original topic: tidb cdc监控grafana的模板中看不到官方文档上显式的同步任务中各数据表的同步进度
[TiDB Usage Environment] Production Environment / Testing / PoC
[TiDB Version] v6.5.0
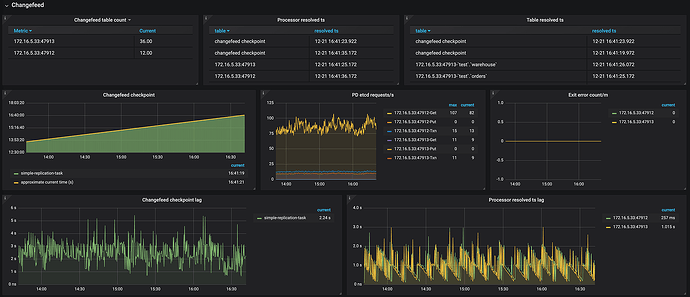
Since we want to integrate TiDB monitoring into our existing Grafana, we did not use the official TiDB Grafana but instead integrated the relevant Grafana templates from the official tidb-community-toolkit package into our existing Grafana. We found that the TiDB CDC monitoring does not include the monitoring of the synchronization progress of each data table in the task mentioned on the official website (the third panel in the first row of the screenshot).
Below is a screenshot from the official website regarding changefeed monitoring:
Could you please tell me the reason?
Do you not have a panel for Grafana changefeed or what does it look like?
There is a changefeed panel, but it is different from the one on the official website. The official website explicitly shows the synchronization progress of each table in the task, but I can’t see it here.
The progress of each table?
The version is correct. Could you post the JSON of the panel for each table’s progress? I’ll take a look.
Yes, take a look at the screenshot on the official website: TiCDC 重要监控指标详解 | PingCAP 文档中心
Which specific panel are you referring to?
It should be a version issue. You can create your own graph based on the Prometheus metric ticdc_scheduler_capture_table. You have a count graph that uses the sum formula; removing the sum and breaking it down should work.
I agree with the previous comment. You can check the calculation formulas of the panels you think have issues. In theory, all metrics have been collected, but there might be problems during processing.
Could you please let me know which specific metric indicates the progress? I don’t see metrics for each data table in the results from http://xxxxx8300/metrics.
Open the Grafana address and enter this ticdc_scheduler_capture_table.
It is about custom monitoring of the synchronization progress of monitoring data tables, right?
Could you please elaborate, or paste the key code of the JSON template? How exactly is the custom monitoring done?
The one about changefeed.
Check the variables on the dashboard to see if they can be displayed normally.
Is it that all the monitoring is missing or just one monitoring item?
They customized it. Although it’s also Grafana. Or maybe there’s a configuration issue, why not try changing it?
Mainly check the following two aspects:
The first is the data source issue. Have you added the TiDB monitoring data source in your own Grafana?
The second is the compatibility issue with versions. Different versions of Grafana may have slight differences, such as modifications to certain fields.
My colleague said… could it be a browser issue?
