Note:
This topic has been translated from a Chinese forum by GPT and might contain errors.
Original topic: tidb主键查询时快时慢
【TiDB Usage Environment】Production environment
【TiDB Version】v4.0.8
【Encountered Problem: Phenomenon and Impact】
In the online TiDB cluster, the same SQL statement, primary key query, has only one execution plan. The table health is 97, and the normal query time is in milliseconds, but it suddenly reaches 5-6 seconds, and sometimes even more than 10 seconds.
【Resource Configuration】CPU: 56 cores, 192G memory, NVMe disk, 70 TiKV nodes
【Attachments: Screenshots/Logs/Monitoring】
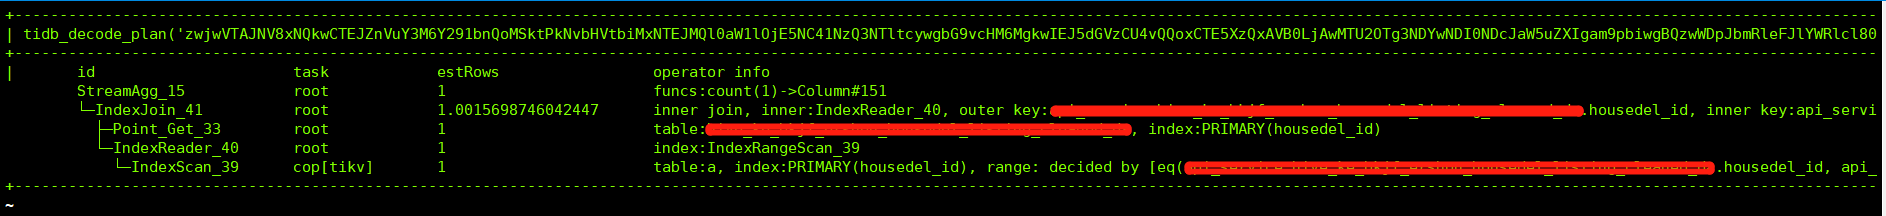
Normal execution plan
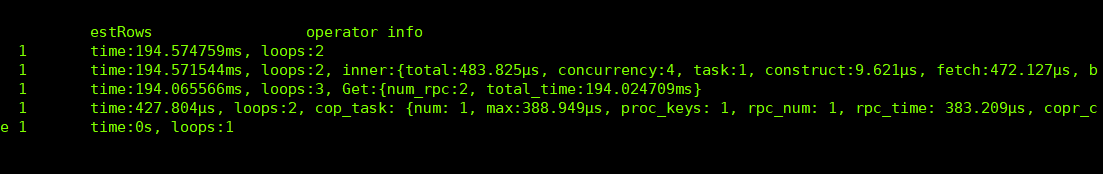
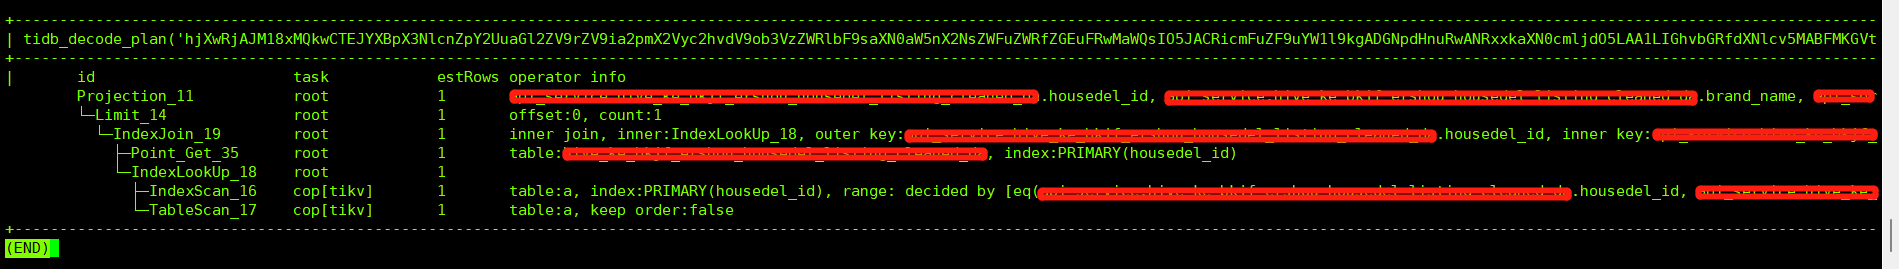
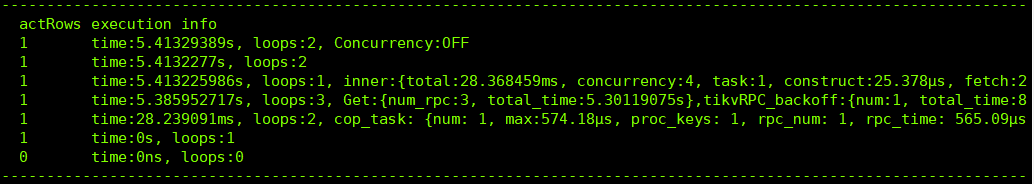
Execution plan when execution time is long:
Please advise, experts.
In the dashboard, look for the actual execution plan, execution time, and transaction statistics for slow SQL queries.
This cluster does not have the dashboard enabled. The execution plan shown in the image is the actual execution plan taken from the slow query log.
Check the time period when the query slows down and see if there are any differences in the cluster monitoring. First, identify whether it’s a TiDB or TiKV issue, and then continue investigating.
Looking at the execution plan you posted, there were multiple backoff retries in TiKV during loops3 execution, causing the latency to increase from 194ms to 5s. This is where the access delay increased. The direction for troubleshooting is to check the situation of TiKV at that time. You can analyze whether there were network delays, GC, lock conflicts, write hotspots, etc., in the cluster.
tikvRPC_backoff: After an RPC request fails, it will retry after waiting for the backoff time. This includes the type of backoff (such as regionMiss, tikvRPC), the total backoff waiting time (total_time), and the total number of backoffs (num).
You can check the TiDB and TiKV logs to see if there are any read-write conflicts during the corresponding time period.
You can also check the I/O; I have encountered issues caused by I/O fluctuations before.
In this situation, I think there might be packet loss in the network. Are there similar phenomena with other statements?
Another approach is that the data distribution is uneven.
Execution plan comparison, resource comparison, IO, locks (QPS, database pressure situation)
If the machine performance is not an issue, check if it’s a data hotspot problem. Is the ID random or auto-incrementing? The region data might not be distributed across the KV nodes.
This topic was automatically closed 60 days after the last reply. New replies are no longer allowed.