Note:
This topic has been translated from a Chinese forum by GPT and might contain errors.Original topic: 慢查询执行时间显示错误
【TiDB Usage Environment】Production Environment
【TiDB Version】v6.5.10
【Encountered Problem: Phenomenon and Impact】
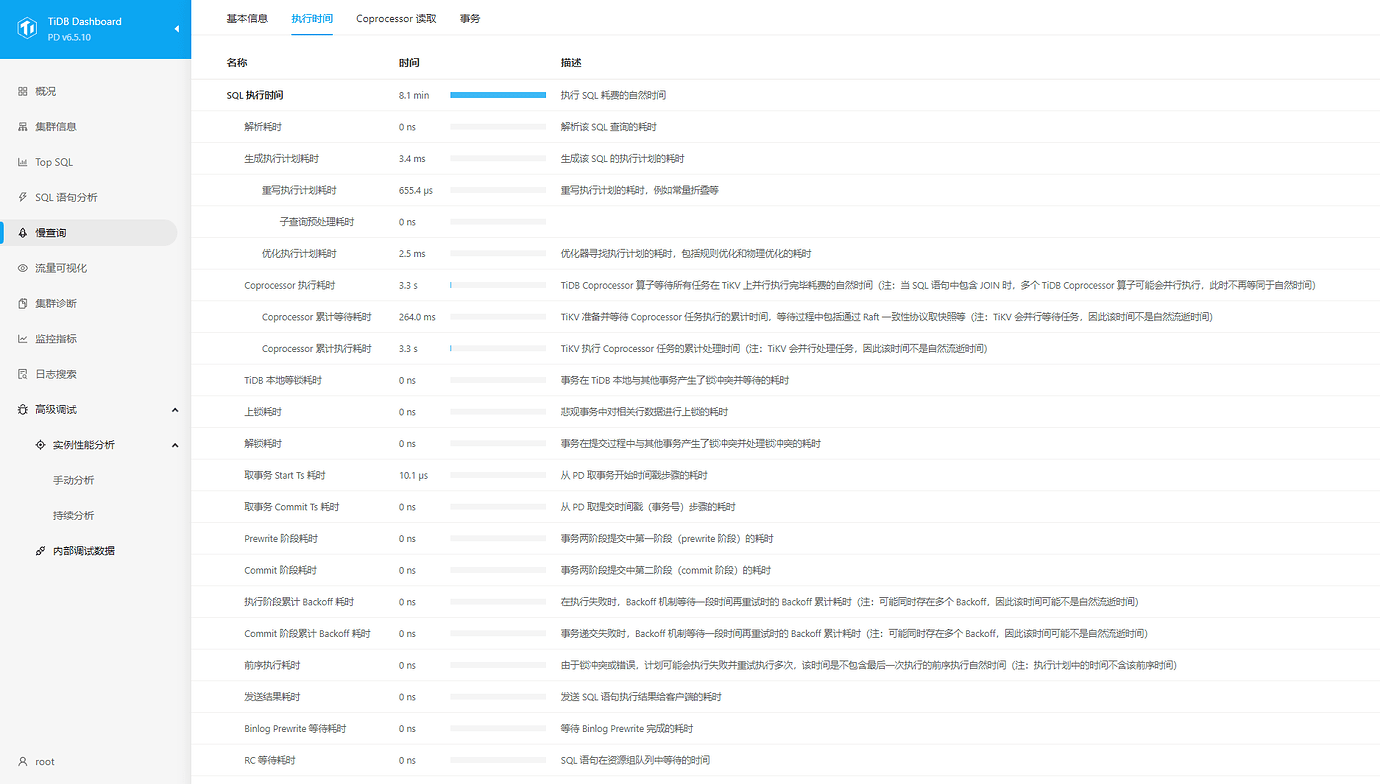
Brothers, in some SQL information in the slow query, only the total execution time is displayed. However, in each displayed step, no time-consuming steps are seen. What is the situation?
【Attachment: Screenshot/Log/Monitoring】