Incorrect Use of Indexes Leading to Out Of Memory Quota!

Note:
This topic has been translated from a Chinese forum by GPT and might contain errors.

Original topic: 未正确使用索引导致Out Of Memory Quota!

| username: TiDBer_ee6XD2z1

[Test Environment for TiDB] Testing
[TiDB Version] 7.0
[Reproduction Path] Springboot + Mybatis
[Encountered Issue: Phenomenon and Impact] A complex long SQL executes normally in Navicat, but when executed through the program (Springboot + Mybatis), it results in “Out Of Memory Quota!”. Monitoring through the dashboard reveals that different indexes are used.
Indexes used by the program to execute SQL:
[hd_iot_app:idx_mid, hd_iot_model:PRIMARY]
Indexes used by standalone SQL execution:
[hd_iot_app:idx_mid, hd_area_relation:idx_anc_des]

[Resource Configuration]
[Attachments: Screenshots/Logs/Monitoring]

| username: Jellybean | Original post link

You can use FORCE INDEX in SQL to force the use of a specific index.

| username: Jellybean | Original post link

To check the health and statistics of the table, you can execute the ANALYZE TABLE statement to manually update the statistics. Then, execute the same SQL again, and it should use the correct index.

| username: tidb菜鸟一只 | Original post link

Please post the SQL and execution plan for review.

| username: xingzhenxiang | Original post link

Try using index or hint.

| username: TiDBer_ee6XD2z1 | Original post link

SELECT 
    a.id, a.name, a.sn, a.code, a.kind, a.address, a.longitude, a.latitude, 
    a.factory, a.category, a.model, a.created, a.aid, a.enable, a.sort, a.rid, 
    a.last_data_time, a.status, a.meter_no, a.cust_no, a.comm_no, a.dev_type, 
    b.name as areaName, b.code as areaCode, d.NAME as modelName, 
    c.NAME AS appName, c.fetchFreq AS fetchFreq, c.offlineDelay AS offlineDelay, 
    c.uploadFreq uploadFreq, c.offline_cycle offlineCycle, 'device' as type 
FROM 
    `hd_device` a 
    JOIN hd_device_area b ON b.id = a.category 
    JOIN hd_area_relation r ON r.des = b.id 
    LEFT JOIN hd_area_relation r1 ON r.anc = r1.des 
    JOIN hd_iot_app c ON c.id = a.aid 
    JOIN hd_iot_model d ON c.mid = d.id 
    LEFT JOIN hd_treenode_cate t ON t.tid = a.id AND t.target = 'division' 
    LEFT JOIN hd_treenode n ON n.id = t.nid 
    LEFT JOIN hd_tag g ON g.tid = a.id AND g.target = 'device' 
WHERE 
    1=1 
    AND (c.mid = 'db' AND r1.anc IN ('8Ur0Mq3YMHFU3wCis2Q6P#1')) 
GROUP BY 
    a.id 
LIMIT 30
| username: TiDBer_ee6XD2z1 | Original post link

The execution plan is very long and I can’t send it. Could you please assist remotely?

| username: TiDBer_ee6XD2z1 | Original post link

There is no problem executing the SQL individually in Navicat. The SQL in the program is dynamic, and the final generated SQL only has differences in line formatting.

| username: Jellybean | Original post link

If executing manually is fine, then it can be confirmed that the issue is introduced by the program generating and executing the SQL. Focus on checking the program logic.

| username: dba-kit | Original post link

Did you use prepare in the program? If so, you can try preparing it in Navicat first and then specify the parameters to see which index is being used.

| username: tidb菜鸟一只 | Original post link

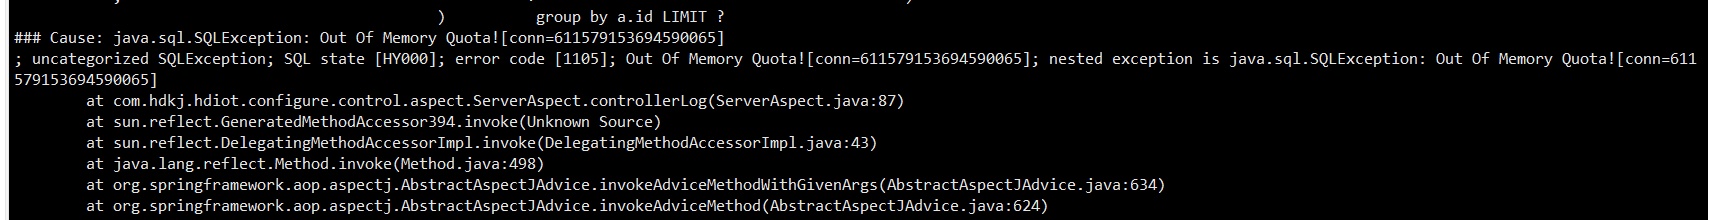
The conditions in your program should all be passed from the frontend, while the conditions you execute separately through the client are specified by you. Therefore, it is reasonable for the execution time and execution plan to be different. You should test whether the conditions passed from your frontend can filter out the most data, and whether the number in the LIMIT clause can be very large. For example, like this:

SELECT
  a.id,
  a.name,
  a.sn,
  a.code,
  a.kind,
  a.address,
  a.longitude,
  a.latitude,
  a.factory,
  a.category,
  a.model,
  a.created,
  a.aid,
  a.enable,
  a.sort,
  a.rid,
  a.last_data_time,
  a.status,
  a.meter_no,
  a.cust_no,
  a.comm_no,
  a.dev_type,
  b.name AS areaName,
  b.code AS areaCode,
  d.NAME AS modelName,
  c.NAME AS appName,
  c.fetchFreq AS fetchFreq,
  c.offlineDelay AS offlineDelay,
  c.uploadFreq uploadFreq,
  c.offline_cycle offlineCycle,
  'device' AS TYPE
FROM
  hd_device a
  JOIN hd_device_area b
    ON b.id = a.category
  JOIN hd_area_relation r
    ON r.des = b.id
  LEFT JOIN hd_area_relation r1
    ON r.anc = r1.des
  JOIN hd_iot_app c
    ON c.id = a.aid
  JOIN hd_iot_model d
    ON c.mid = d.id
  LEFT JOIN hd_treenode_cate t
    ON t.tid = a.id
  LEFT JOIN hd_treenode n
    ON n.id = t.nid
  LEFT JOIN hd_tag g
    ON g.tid = a.id
WHERE 1 = 1
GROUP BY a.id LIMIT 10000000000

Additionally, if you have configured prepstmt in the connection string of your program, all SQL statements will follow the same execution plan. You need to consider whether it is still appropriate to follow this execution plan when you choose the most general conditions.

| username: TiDBer_ee6XD2z1 | Original post link

The data was just migrated from MySQL, and there were no issues when it was running in the MySQL environment before.

| username: TiDBer_ee6XD2z1 | Original post link

The link did not enable prepstmt.

| username: TiDBer_ee6XD2z1 | Original post link

In this SQL, several tables have data volumes around 3 million, and one table has a data volume around 7 million. The limit passed from the frontend is restricted, and currently, the issue is that the limit value is 30.

| username: tidb菜鸟一只 | Original post link

The limit issue can be ruled out. You mentioned that the data was just migrated from MySQL and there were no problems running in the MySQL environment before, so it should simply be a case of the SQL execution plan going wrong, not a front-end development issue. Also, you haven’t enabled prepstmt. Check if the statistics of the involved tables are up-to-date. You can collect the statistics and then review the execution plan.

| username: TiDBer_ee6XD2z1 | Original post link

I re-executed the analyze command, and it was successful. Thank you! However, the performance seems to be inferior to MySQL 8.0. For the same SQL query with the same execution plan, MySQL 8.0 takes 0.4 seconds, while TiDB takes 19 seconds. I’m new to this; could you point me in the direction of performance optimization?

| username: TiDBer_ee6XD2z1 | Original post link

It indeed works now.

| username: tidb菜鸟一只 | Original post link

You can check the execution details of the SQL on the TiDB dashboard page to see where it is slow. The normal speed should not differ this much.

| username: system | Original post link

This topic was automatically closed 60 days after the last reply. New replies are no longer allowed.