Note:
This topic has been translated from a Chinese forum by GPT and might contain errors.
Original topic: tidb p99,p999时延升高
[TiDB Usage Environment] Production Environment / Test / Poc
Production Environment
[TiDB Version]
v.4.0.8
[Reproduction Path] What operations were performed when the issue occurred
Deleted partitions from the past year (approximately 2000), added partitions for the next year (approximately 2000)
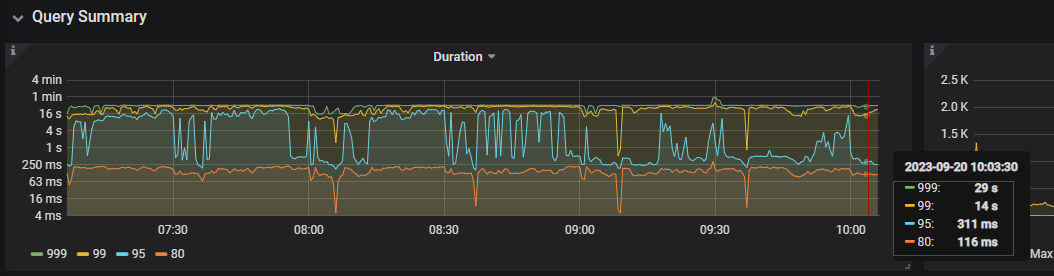
The duration for p99, p999, and p90 in TiDB significantly increased
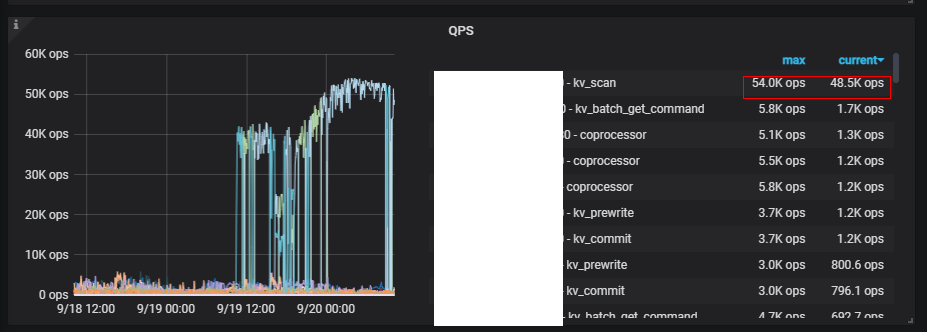
In the TiKV monitoring QPS, you can see kv_scan increasing alternately on multiple TiKV nodes, reaching 40,000 per second
[Encountered Issue: Problem Phenomenon and Impact]
[Resource Configuration] Go to TiDB Dashboard - Cluster Info - Hosts and take a screenshot of this page
[Attachments: Screenshots/Logs/Monitoring]
After deleting so many partitions, there should be GC, compaction, and rebalancing of regions across various TiKV nodes. How long has it been since the deletion? You can observe it for a while.
The deletion started at 10 AM yesterday and was completed around 12 PM. The latency has not recovered since then. TiDB was restarted during this period, but after a while, the latency increased again. How can I check the progress of the regions? Currently, the number of empty regions has increased.
Are there any slow queries in the business now?
Yes, obviously the update and insert operations have both slowed down.
Perform deletion operations and other tasks during off-peak business hours, as partition balancing is quite resource-intensive.
It’s been a day since the deletion was completed, and there are no signs of recovery. The kv_scan metric remains high, suspecting that it’s caused by GC.
– Adjust GC to retain data from the last day, but it doesn’t seem to make any difference
update mysql.tidb set VARIABLE_VALUE=“24h” where VARIABLE_NAME=“tikv_gc_life_time”;
You can check inside Grafana, there is a series of GC monitoring charts under tikv-detail.
Here is the final solution:
Set the GC retention time to 24 hours and proactively trigger data expiration:
update mysql.tidb set VARIABLE_VALUE="24h" where VARIABLE_NAME="tikv_gc_life_time";
The number of empty regions increases.
Set the following parameters in PD to increase the speed of empty region merge:
-- Merge empty regions
config set max-merge-region-keys 200000
config set merge-schedule-limit 10
config set enable-cross-table-merge true
Finally, after the merge is almost complete (approximately 3 hours later), restart the TiDB server. After the restart, the QPS monitoring of the kv_scan command in TiKV drops from 50k/s to 4k/s.
This topic was automatically closed 60 days after the last reply. New replies are no longer allowed.