Note:
This topic has been translated from a Chinese forum by GPT and might contain errors.
Original topic: 索引失效问题
[TiDB Usage Environment] Production Environment
[TiDB Version]
[Reproduction Path] What operations were performed when the issue occurred
[Encountered Issue: Issue Phenomenon and Impact]
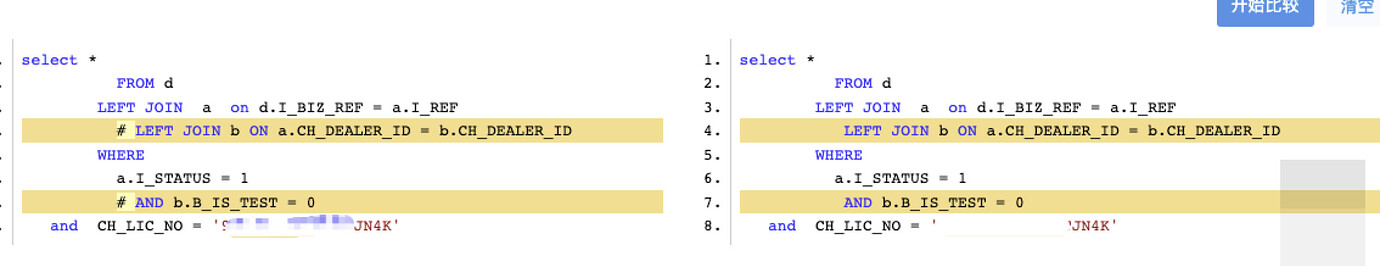
Left side is extremely fast, right side is particularly slow
Table a joins table b, table b joins table c, all join conditions have indexes, where condition queries based on table a, the query is particularly slow
Table a joins table b, table b joins table b, all join conditions have indexes, where condition queries based on table a, the query is particularly fast
[Resource Configuration]
[Attachments: Screenshots/Logs/Monitoring]
Check the execution plan and compare the differences.
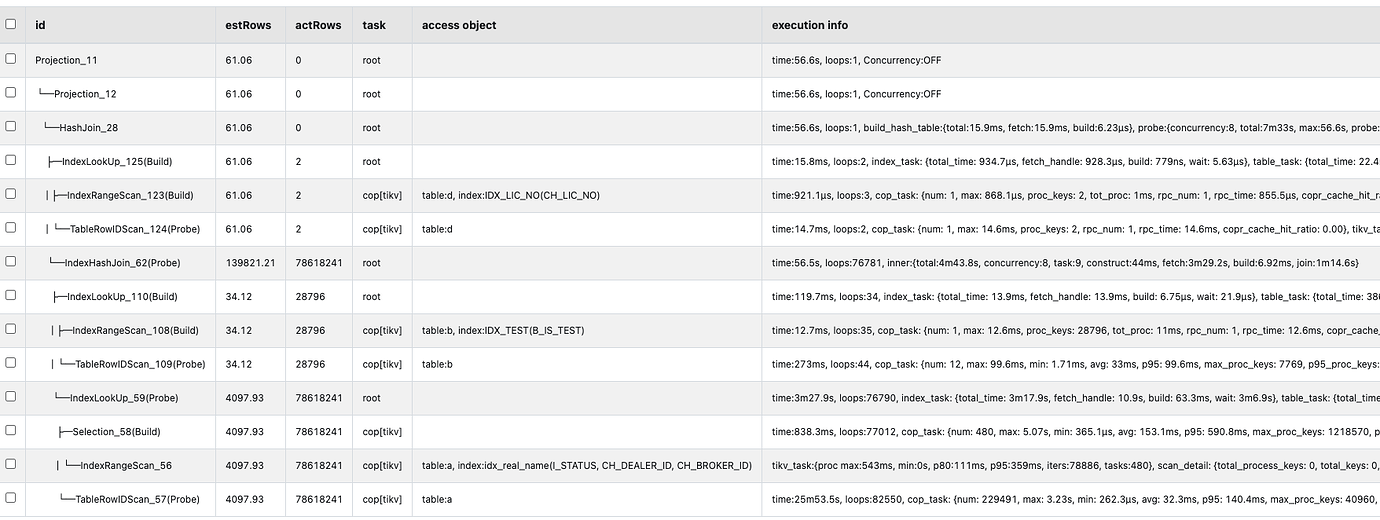
Post the execution plan and take a look. I think the issue is that neither of the two tables, a and b, are using the index on the join fields. So when doing a left outer join with table a, the i_status filter on a might be more selective, hence the speed is acceptable. However, when doing a left outer join with table b, the b_is_test filter on b is less selective, resulting in slower performance. You can test the speed by doing a left outer join between table d and table b separately.
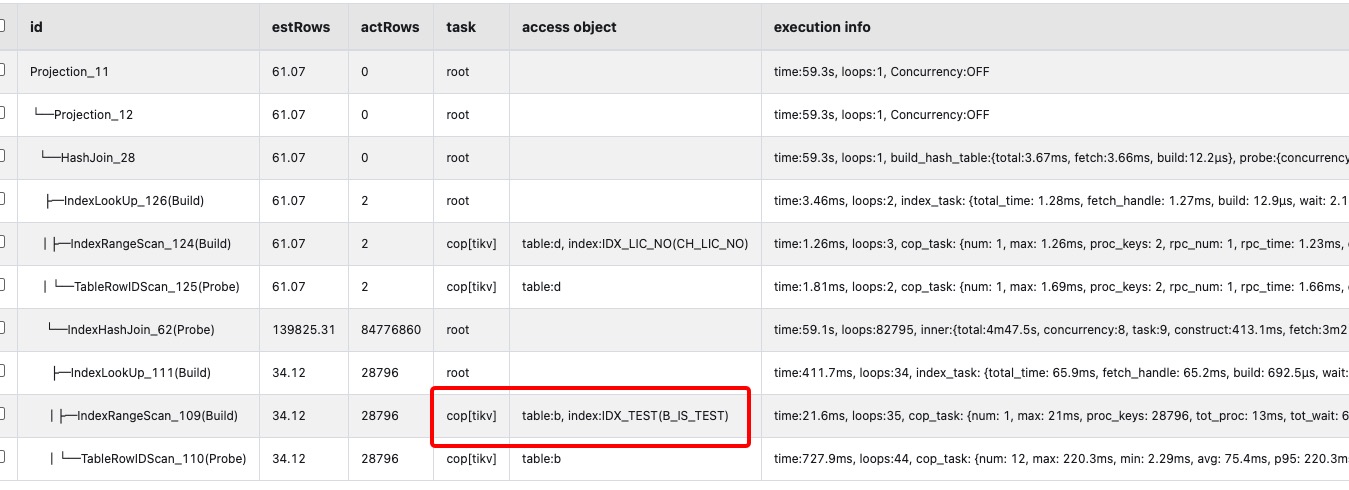
Execution plan with slow speed
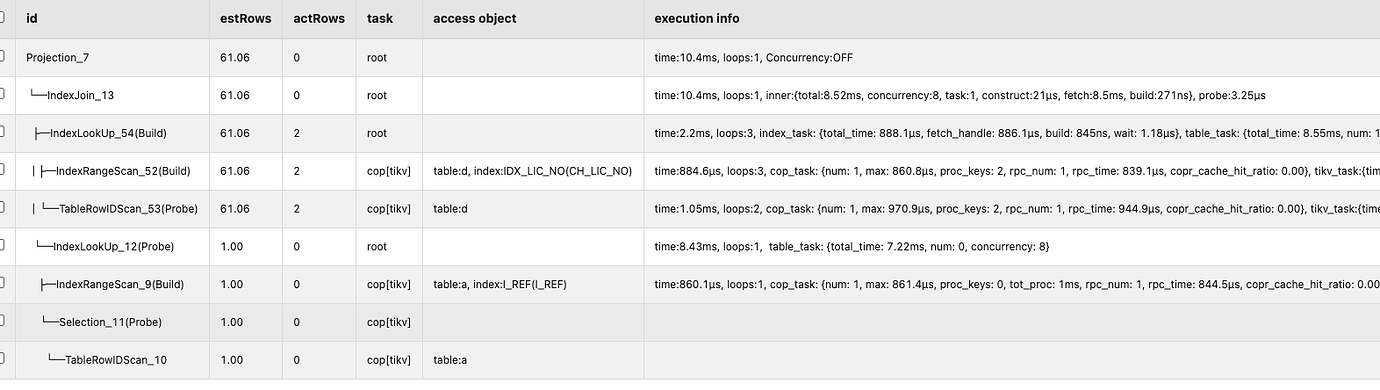
A plan with fast execution speed
How is the filtering of b_is_test in table b? I see that it has reached the index on this field. Is the actual statistical information accurate?
How to determine if the statistics are accurate?
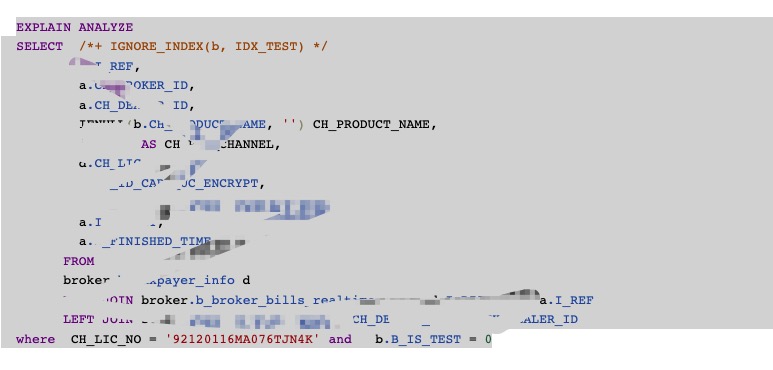
Have you tried forcing an index join? I’ve encountered a similar situation where the optimizer chooses a hash join, which results in very slow performance.
I recently discovered that an incorrect index was used.
How can I make it use the index of the associated key?
This topic was automatically closed 60 days after the last reply. New replies are no longer allowed.