Note:
This topic has been translated from a Chinese forum by GPT and might contain errors.
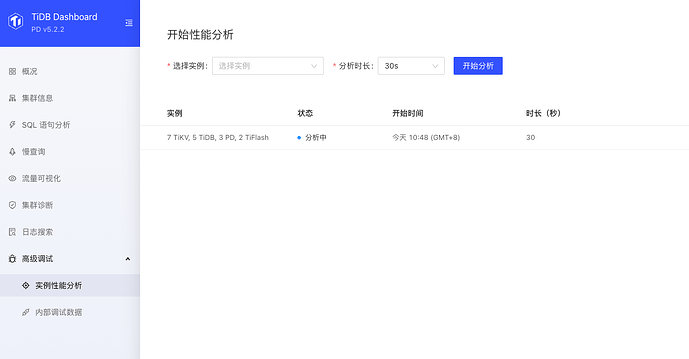
Original topic: 实例性能分析卡在99%不动
[TiDB Usage Environment] Production Environment / Testing / PoC
[TiDB Version] 5.2.2
[Encountered Issue] Instance performance analysis stuck at 99%
[Reproduction Path] Steps taken that led to the issue
Clicked on instance performance analysis at 10:48 AM, and by 2:48 PM, 4 hours later, it was still stuck at 99%
[Issue Phenomenon and Impact]
[Attachment]
The image you provided is not accessible. Please provide the text content you need translated.
How can I check the cause of the hang, and how can I terminate it?
Check the dashboard logs…
How large is the cluster? How long did it take to analyze up to 99%?
Can selecting a single instance for analysis be successful?
It’s not quite 6TB, and it’s still at 99%. It’s been nearly 12 hours now.
Didn’t find any critical error information, are there any key logs?
It reached 99% in less than 10 minutes, but then it stopped moving. Is there a way to cancel it?
You need to upload the logs.
Why doesn’t yours have the analysis type option?
Version issue? I’m using 5.2.2.
There are too many logs, I don’t know which logs to upload~
The lower version seems to not have that option, mine doesn’t have it either.
It reached 99% in less than 10 minutes, but then it stopped moving. Is there a way to cancel it?
There is no exit, pause, or cancel button.
After initiating this function on the frontend, I’m not sure if it’s possible to view the related processes on the node’s operating system.
If there is no button, is there any way to cancel it? I see it’s still there.
No, and I can’t find the corresponding process.
If it’s not a core business environment, you can try restarting the PD node where the dashboard is located (UI node).
